Labs
1. Setting up Prometheus
In this first section we are going to eplore the already set up Prometheus stack. Each trainee will have their own stack to work with.
How do metrics end up in Prometheus?
Since Prometheus is a pull-based monitoring system, the Prometheus server maintains a set of targets to scrape. This set can be configured using the scrape_configs option in the Prometheus configuration file. The scrape_configs consist of a list of jobs defining the targets as well as additional parameters (path, port, authentication, etc.) which are required to scrape these targets. As we will be using the Prometheus Operator on Kubernetes, we will never actually touch this configuration file by ourselves. Instead, we rely on the abstractions provided by the Operator, which we will look at closer in the next section.
There are two basic types of targets that we can add to our Prometheus server:
Static targets
In this case, we define one or more targets statically. In order to make changes to the list, you need to change the configuration file. As the name implies, this way of defining targets is inflexible and not suited to monitor workloads inside of Kubernetes as these are highly dynamic.
We will use this type of configuration in the task 2.1 .
Dynamic configuration
Besides the static target configuration, Prometheus provides many ways to dynamically add/remove targets. There are builtin service discovery mechanisms for cloud providers such as AWS, GCP, Hetzner, and many more. In addition, there are more versatile discovery mechanisms available which allow you to implement Prometheus in your environment (e.g. DNS service discovery or file service discovery). Most importantly, the Prometheus Operator makes it very easy to let Prometheus discover targets dynamically using the Kubernetes API.
Prometheus Operator
The Prometheus Operator is the preferred way of running Prometheus inside of a Kubernetes Cluster. In the following labs you will get to know its CustomResources in more detail, which are the following:
- Prometheus : Manage the Prometheus instances
- Alertmanager : Manage the Alertmanager instances
- ServiceMonitor : Generate Kubernetes service discovery scrape configuration based on Kubernetes service definitions
- PrometheusRule : Manage the Prometheus rules of your Prometheus
- AlertmanagerConfig : Add additional receivers and routes to your existing Alertmanager configuration
- PodMonitor : Generate Kubernetes service discovery scrape configuration based on Kubernetes pod definitions
- Probe : Manage Prometheus blackbox exporter targets
- ThanosRuler : Manage Thanos rulers
Service Discovery
When configuring Prometheus to scrape metrics from containers deployed in a Kubernetes Cluster it doesn’t really make sense to configure every single target (Pod) manually. That would be far too static and wouldn’t really work in a highly dynamic environment. A container platform is too dynamic. Pods can be scaled, the names are random and so on.
In fact, we tightly integrate Prometheus with Kubernetes and let Prometheus discover the targets, which need to be scraped, automatically via the Kubernetes API.
The tight integration between Prometheus and Kubernetes can be configured with the Kubernetes Service Discovery Config .
The way we instruct Prometheus to scrape metrics from an application running as a Pod is by creating a ServiceMonitor.
ServiceMonitors are Kubernetes custom resources, which look like this:
# just an example
apiVersion: monitoring.coreos.com/v1
kind: ServiceMonitor
metadata:
  labels:
    app.kubernetes.io/name: example-web-python
  name: example-web-python-monitor
spec:
  endpoints:
  - interval: 30s
    port: http
    scheme: http
    path: /metrics
  selector:
    matchLabels:
      prometheus-monitoring: 'true'
How does it work
The Prometheus Operator watches namespaces for ServiceMonitor custom resources. It then updates the Service Discovery configuration of the Prometheus server(s) accordingly.
The selector part in the ServiceMonitor defines which Kubernetes Services will be scraped. Here we are selecting the correct service by defining a selector on the label prometheus-monitoring: 'true'.
# servicemonitor.yaml
...
  selector:
    matchLabels:
      prometheus-monitoring: 'true'
...
The corresponding Service needs to have this label set:
apiVersion: v1
kind: Service
metadata:
  name: example-web-python
  labels:
    prometheus-monitoring: 'true'
...
The Prometheus Operator then determines all Endpoints(which are basically the IPs of the Pods) that belong to this Service using the Kubernetes API. The Endpoints are then dynamically added as targets to the Prometheus server(s).
The spec section in the ServiceMonitor resource allows further configuration on how to scrape the targets.
In our case Prometheus will scrape:
- Every 30 seconds
- Look for a port with the name
http(this must match the name in theServiceresource) - Scrape metrics from the path
/metricsusinghttp
Best practices
Use the common k8s labels https://kubernetes.io/docs/concepts/overview/working-with-objects/common-labels/
If possible, reduce the number of different ServiceMonitors for an application and thereby reduce the overall complexity.
- Use the same
matchLabelson differentServicesfor your application (e.g. Frontend Service, Backend Service, Database Service) - Also make sure the ports of different
Serviceshave the same name - Expose your metrics under the same path
Add your application as monitoring target at Baloise
Have a look at the Add Monitoring Targets outside of OpenShift documentation. There are two ways to add machines outside of OpenShift to your monitoring stack.
- Using
File Service Discoveryyou have the following options (lab 2.1 )- Add targets using TLS and using the default credentials provided
- Add targets without TLS and authentication
- You can use the approach with
ServiceMonitors, which provides more flexibility for cases like- custom targets with non standard basic authentication
- custom targets with non TLS and non standard basic authentication
- provide ca to verify custom certificate on the exporter side
- define a non default
scrape_interval
1.1 Tasks: Setup
Executing oc commands
Note
As you will be executing some oc commands in the following labs, make sure you have the tool installed and are logged in to your OpenShift Cluster.
You can copy the login Command from the OpenShift UI:
- Browse to http://LOCALHOST_OPENSHIFT
- Click on your name in the top right
Copy login command- Replace
6443with443
Task 1.1.1: Identify your monitoring repository
Before we get started, take the time to familiarize yourself with the your config repository. In the training you will not be working with the config repository of your team to prevent the training resources from getting in the way of the day to day business. You can find more information on how to deploy the Baloise monitoring stack for your team at Deploying the Baloise Monitoring Stack .
The working directory for this training is the folder in your config repository
with the -monitoring suffix. If necessary, create the directory <team>-monitoring.
Warning
Please name all files created in this training with the filename prefixtraining_. This naming pattern will help in cleaning up all related files after training completion.Task 1.1.2: Deploy example application
Note
We will deploy an application for demonstration purposes in our monitoring namespace. This should never be done for production use cases. If you are familiar with deploying on OpenShift, you can complete this lab by deploying the application on our test cluster.Create the following file training_python-deployment.yaml in your monitoring directory.
apiVersion: apps/v1
kind: Deployment
metadata:
  labels:
    app: example-web-python
  name: example-web-python
spec:
  replicas: 1
  selector:
    matchLabels:
      app: example-web-python
  template:
    metadata:
      labels:
        app: example-web-python
    spec:
      containers:
      - image: quay.io/acend/example-web-python
        imagePullPolicy: Always
        name: example-web-python
      restartPolicy: Always
Use the following command to verify that the pod of the deployment example-web-python is ready and running (use CTRL+C to exit the command).
team=<team>
oc -n $team-monitoring get pod -w -l app=example-web-python
We also need to create a Service for the new application. Create a file with the name training_python-service.yaml with the following content:
apiVersion: v1
kind: Service
metadata:
  name: example-web-python
  labels:
    app: example-web-python
spec:
  ports:
    - name: http
      port: 5000
      protocol: TCP
      targetPort: 5000
  selector:
    app: example-web-python
  type: ClusterIP
This created a so-called Kubernetes Service
team=<team>
oc -n $team-monitoring get svc -l app=example-web-python
Which gives you an output similar to this:
NAME                 TYPE       CLUSTER-IP       EXTERNAL-IP   PORT(S)          AGE
example-web-python                  ClusterIP   172.24.195.25    <none>        5000/TCP                     24s
Our example application can now be reached on port 5000.
We can now make the application directly available on our machine using port-forward
team=<team>
oc -n $team-monitoring port-forward svc/example-web-python 5000
Use curl and verify the successful deployment of our example application in a separate terminal:
curl localhost:5000/metrics
Should result in something like:
# HELP python_gc_objects_collected_total Objects collected during gc
# TYPE python_gc_objects_collected_total counter
python_gc_objects_collected_total{generation="0"} 541.0
python_gc_objects_collected_total{generation="1"} 344.0
python_gc_objects_collected_total{generation="2"} 15.0
...
Since our newly deployed application now exposes metrics, the next thing we need to do, is to tell our Prometheus server to scrape metrics from the Kubernetes deployment. In a highly dynamic environment like Kubernetes this is done with so called Service Discovery.
Task 1.1.3: Create a ServiceMonitor
Task description:
Create a ServiceMonitor for the example application.
- Create a ServiceMonitor, which will configure Prometheus to scrape metrics from the example-web-python application every 30 seconds.
For this to work, you need to ensure:
- The example-web-python Service is labeled correctly and matches the labels you’ve defined in your ServiceMonitor.
- The port name in your ServiceMonitor configuration matches the port name in the Service definition.
- hint: check with
oc -n <team>-monitoring get service example-web-python -o yaml
- hint: check with
- Verify the target in the Prometheus user interface.
Hints
Create the following ServiceMonitor (training_python-servicemonitor.yaml):
apiVersion: monitoring.coreos.com/v1
kind: ServiceMonitor
metadata:
  labels:
    app.kubernetes.io/name: example-web-python
  name: example-web-python-monitor
spec:
  endpoints:
    - interval: 30s
      port: http
      scheme: http
      path: /metrics
  selector:
    matchLabels:
      app: example-web-python
Verify that the target gets scraped in the Prometheus user interface (either on CAASI or CAAST, depending where you deployed the application).
Navigate to the list of targets by clicking Status and then Targets in the menu. Target name: serviceMonitor/<team>-monitoring/example-web-python-monitor/0 (it may take up to a minute for Prometheus to load the new
configuration and scrape the metrics).
2. Metrics
In this lab you are going to learn about the Prometheus exposition format and how metrics and their values are represented withing the Prometheus ecosystem.
Prometheus exposition format
Prometheus consumes metrics in Prometheus text-based exposition format and plans to adopt the OpenMetrics standard: https://prometheus.io/docs/introduction/roadmap/#adopt-openmetrics .
Optionally check Prometheus Exposition Format for a more detailed explanation of the format.
All metrics within Prometheus are scraped, stored and queried in the following format:
# HELP <metric name> <info>
# TYPE <metric name> <metric type>
<metric name>{<label name>=<label value>, ...} <sample value>
The Prometheus server exposes and collects its own metrics too. You can easily explore the metrics with your browser under (http://LOCALHOST_PROM/metrics ).
Metrics similar to the following will be shown:
...
# HELP prometheus_tsdb_head_min_time_seconds Minimum time bound of the head block.
# TYPE prometheus_tsdb_head_min_time_seconds gauge
prometheus_tsdb_head_min_time_seconds 1.669622401e+09
# HELP prometheus_tsdb_head_samples_appended_total Total number of appended samples.
# TYPE prometheus_tsdb_head_samples_appended_total counter
prometheus_tsdb_head_samples_appended_total 2.5110946e+07
...
Metric Types
There are 4 different metric types in Prometheus
- Counter, (Basic use cases, always goes up)
- Gauge, (Basic use cases, can go up and down)
- Histogram, (Advanced use cases)
- Summary, (Advanced use cases)
For now we focus on Counter and Gauge.
Find additional information in the official Prometheus Metric Types docs.
Special labels
As you have already seen in several examples, a Prometheus metric is defined by one or more labels with the corresponding values. Two of those labels are special, because the Prometheus server will automatically generate them for every metric:
instance
The instance label describes the endpoint where Prometheus scraped the metric. This can be any application or exporter. In addition to the IP address or hostname, this label usually also contains the port number. Example:
10.0.0.25:9100.job
This label contains the name of the scrape job as configured in the Prometheus configuration file. All instances configured in the same scrape job will share the same job label. In a Kubernetes environment this relates to the
Service-Name.
Note
Prometheus will append these labels dynamically before sample ingestion. Therefore you will not see these labels if you query the metrics endpoint directly (e.g. by usingcurl).Let’s take a look at the following ServiceMonitor (example, no need to apply this to the cluster):
apiVersion: monitoring.coreos.com/v1
kind: ServiceMonitor
metadata:
  labels:
    app.kubernetes.io/name: example-web-python
  name: example-web-python-monitor
spec:
  endpoints:
  - interval: 30s
    port: http
    scheme: http
    path: /metrics
  selector:
    matchLabels:
      name: example-web-python-monitor
In the example above we instructed Prometheus to scrape all Pods that are matched by the Service named example-web-python-monitor. After ingestion into Prometheus, every metric scraped by this job will have the label: job="example-web-python-monitor". In addition, metrics scraped by this job from the Pod with IP 10.0.0.25 will have the label instance="10.0.0.25:80"
Node Exporter
The tasks of this chapter will all be based on metrics that are provided by the node_exporter. An exporter is generally used to expose metrics from an application or system that would otherwise not expose metrics natively in the Prometheus exposition format. You will learn more about other exporters in the lab 4
.
In case of the node_exporter, the system we’re interested in are Linux machines. It gathers the necessary information from different files and folders (e.g. /proc/net/arp, /proc/sys/fs/file-nr, etc.) and therefore is able to expose information about common metrics like CPU, Memory, Disk, Network, etc., which makes it very useful for expanding Prometheus’ monitoring capabilities into the infrastructure world.
2.1 Tasks: File-Based Service Discovery
In this lab you are going to configure Prometheus to scrape OpenShift-external targets by using file-based service discovery.
Task 2.1.1: Create static targets
We are going to use the file-based service discovery mechanism that has been deployed on OpenShift (documented in Confluence ). As file input you will create a ConfigMap defining the static targets.
In the monitoring folder within your repository, create a YAML file training_target.yaml defining a ConfigMap and add the file to your repository. Use the following example:
apiVersion: v1
kind: ConfigMap
metadata:
  name: mylinuxvms # provide a name
  labels:
    monitoring: external # provide label to match monitoring procedure
data:
  auth-mylinuxvms.yaml: | # provide an unique file name
    - targets: # provide targets
        - myhost1.balgroupit.com:9100 # path defaults to /metrics
      labels: # provide additional labels (optional)
        cmdbName: ServerLinux
        namespace: foo
        env: nonprod
In our example we added the host myhost1.balgroupit.com with an exporter running on port 9100 as static target. We also added custom labels to help us identify our metrics.
Task 2.1.2: Verify
As soon as the ConfigMap has been synchronized by ArgoCD, your defined targets should appear in Prometheus in the “Status -> Targets” submenu.
Verify in the web UI .
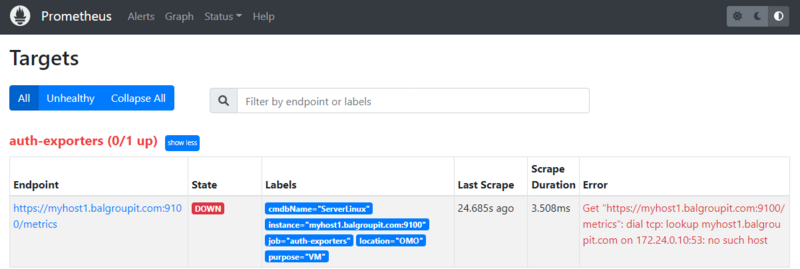
As you can see, the target is down and cannot be scraped by Prometheus. The reason is provided in the error message: Get "https://myhost1.balgroupit.com:9100/metrics": dial tcp: lookup myhost1.balgroupit.com on 172.24.0.10:53: no such host
Note
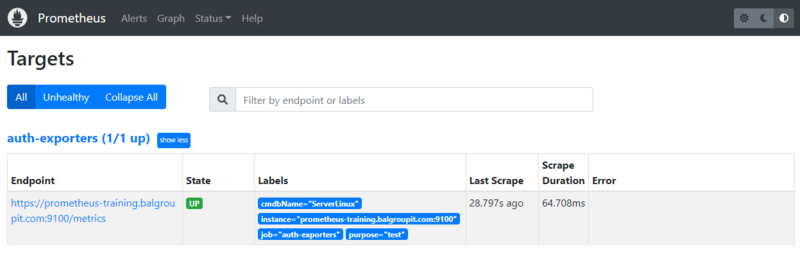
Other targets may already be defined. You can ignore these for now.In our example we used a non-existing host myhost1.balgroupit.com. To fix this, use the existing host prometheus-training.balgroupit.com as your target.
apiVersion: v1
kind: ConfigMap
metadata:
  name: mylinuxvms
  labels:
    monitoring: external
data:
  auth-mylinuxvms.yaml: |
    - targets: # provide targets
        - prometheus-training.balgroupit.com:9100
      labels:
        cmdbName: ServerLinux
        namespace: foo
Check the target again and make sure it is shown as up.
2.2 Tasks: Explore metrics
In this lab you are going to explore various metrics, which your Prometheus server is collecting.
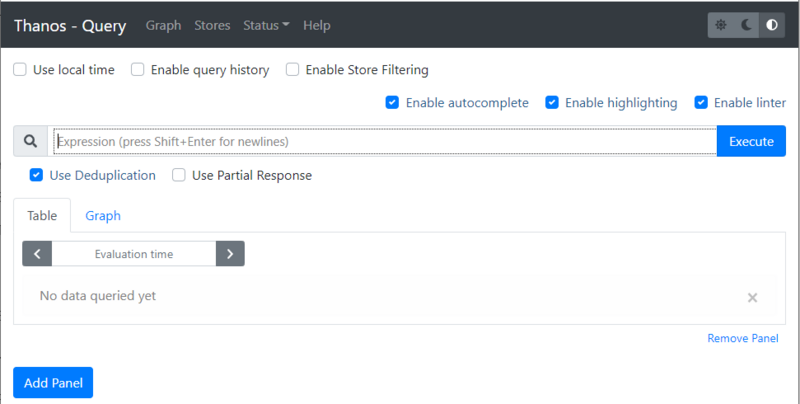
Task 2.2.1: Prometheus/Thanos web UI
As we have multiple Prometheus instances, we will use the Thanos Querier to query metrics on our Prometheus instances running on different clusters. To get an overview of the how Thanos fits into the picture, check out the diagram in Confluence
Get a feel for how to use the Thanos Querier web UI. Open the web UI and navigate to the Graph menu (right on top in the grey navigation bar next to Stores).
Hints
Let’s start and find a memory related metric. The best way to start is by typing node_memory in the expression bar.
Note
As soon as you start typing a dropdown with matching metrics is shown.
Select a metric such as node_memory_MemFree_bytes and click the Execute button.
The result of your first Query will be available under the two tabs:
- Table
- Graph
Explore those two views on your results. Shrink the time range in the Graph tab.
Task 2.2.2: Metric Prometheus server version
Prometheus collects its own metrics, so information such as the current build version of your Prometheus server is displayed as a metric.
Let’s find a metric that shows you the version of your Prometheus server.
Hints
Start typing prometheus_... in the expression browser, choose the prometheus_build_info metric and click the Execute Button.
Something similar to the following will be displayed
prometheus_build_info{branch="HEAD", cluster="caasi01", container="prometheus-proxy", endpoint="web", goversion="go1.18.4", instance="172.16.2.103:9093", job="prometheus", monitoringselector="clustermonitoring", namespace="ch-application-security-monitoring", pod="prometheus-prometheus-0", prometheus="config-caasi01-monitoring/prometheus", revision="b41e0750abf5cc18d8233161560731de05199330", service="prometheus", version="2.37.0"}
...
The actual Version of your Prometheus Server will be available as label version
{version="2.37.0"}
Task 2.2.3: Metric TCP sockets
Let’s explore a node exporter metric in this lab.
- Find a metric that shows you the number of TCP sockets in use
- Display the number 5 minutes ago
- Display the numbers in a graph over the last 15 minutes
Hints
The node exporter metrics are all available in the node namespace
.
The number of TCP sockets in use are available in the following metric.
node_sockstat_TCP_inuse
You can select a specific time series by filtering by the instance label.
node_sockstat_TCP_inuse{instance="prometheus-training.balgroupit.com:9100"}
If you want to display the value 5 minutes ago, you’ll have to add the correct timestamp in the Evaluation time field.
Switch to the Graph tab and change the value of the timepicker from 1h to 15m to display the graph over the last 15 minutes.
Task 2.2.4: Metric network interfaces
Most virtual Linux machines nowadays have network interfaces. The node exporter you have enabled and configured in the previous lab also exposes metrics about network components.
Show all network interfaces where the device name starts with ens
Hints
The network interfaces are available in the following series:
node_network_info
The result includes all sorts of network interface. If you need to filter the result by a label you will have to alter your query:
node_network_info{device="ens192"}
But this will only show results for the exact ens192 interface. The Task was to show all interfaces that start with ens192.
In this case we have to use Time series Selectors to create a matching filter:
node_disk_filesystem_info{device=~"sd.*"}
There will be a lot more about queries and filtering in the next Labs
Task 2.2.5: CMDB monitoring (optional)
If your team does not use virtual machines, you can skip this task.
As soon as a virtual machine is defined in the CMDB , it is added to the monitoring stack using the defined business services. These servers are monitored automatically with generally defined alerts. To check if there are already some machines being monitored by the monitoring stack, navigate to your teams Thanos. Your example monitoring stack will obviously not have these targets configured.
- Use the selector
managed="cmdb-service-asset"and the metricup.
Hints
The servers can be listed using the following series:
up{managed="cmdb-service-asset"}
Note
You may not be using virtual machines and therefore the list is empty.
2.3 Tasks: PromQL
In this lab you are going to learn a bit more about PromQL (Prometheus Query Language) .
PromQL is the query language that allows you to select, aggregate and filter the time series data collected by prometheus in real time.
Note
Execute the queries in the Thanos Querier UI .
PromQL can seem overwhelming. It may take a little time to get used to it. There may be different approaches to solve the tasks. Our solution is just one possibility.
Task 2.3.1: Explore Examples
In this first task you are going to explore some querying examples.
Get all time series with the metric prometheus_http_requests_total.
prometheus_http_requests_total
The result represents the time series for the http requests sent to your Prometheus server as an instant vector.
Get all time series with the metric prometheus_http_requests_total and the given code and handler labels.
Additionally select your monitoring namespace using the namespace label.
prometheus_http_requests_total{code="200", handler="/api/v1/targets",namespace="<team>-monitoring"}
The result will show you the time series for the http requests sent to the query endpoint of your Prometheus Server, which were successful ( HTTP status code 200 ).
Get a whole range of time (5 minutes) for the same vector, making it a range vector:
prometheus_http_requests_total{code="200", handler="/api/v1/targets",namespace="<team>-monitoring"}[5m]
A range vector can not be graphed directly in the Prometheus UI, use the table view to display the result.
With regular expressions you can filter time series only for handlers whose name matches a certain pattern, in this case all handlers starting with /api:
prometheus_http_requests_total{handler=~"/api.*", namespace="<team>-monitoring"}
All regular expressions in Prometheus use the RE2 syntax . To select all HTTP status codes except 2xx, you would execute:
prometheus_http_requests_total{code!~"2..",namespace="<team>-monitoring"}
Task 2.3.2: Sum Aggregation Operator
The Prometheus Aggregation operators help us to aggregate time series in PromQL.
There is a Prometheus metric that represents all samples scraped by Prometheus. Let’s sum up the metrics returned.
Hints
The metric scrape_samples_scraped represents the total of scraped samples by job and instance. To get the total amount of scraped samples, we use the Prometheus aggregation operators
sum to sum the values.
Additionally select your Prometheus instance using the prometheus label. Replace <team>-monitoring/prometheus with the monitoring name you defined earlier in lab 01.
sum(scrape_samples_scraped{prometheus="<team>-monitoring/prometheus"})
Task 2.3.3: Rate Function
Use the rate() function to display the current CPU idle usage per CPU core of the server in % based on data of the last 5 minutes.
Hints
The CPU metrics are collected and exposed by the node_exporter therefore the metric we’re looking for is under the node namespace.
node_cpu_seconds_total
To get the idle CPU seconds, we add the label filter {mode="idle"}.
Note
Select a specific node by filtering using the label instance. In our case and in the following examples, use prometheus-training.balgroupit.com:9100 as a reference.
Since the rate function calculates the per-second average increase of the time series in a range vector, we have to pass a range vector to the function.
To get the idle usage in % we therefore have to multiply it with 100.
rate(
  node_cpu_seconds_total{mode="idle",instance="prometheus-training.balgroupit.com:9100"}[5m]
  )
* 100
Task 2.3.4: Arithmetic Binary Operator
In the previous lab, we created a query that returns the CPU idle usage. Now let’s reuse that query to create a query that returns the current CPU usage per core of the server in %. The usage is the total (100%) minus the CPU usage idle.
Hints
To get the CPU usage we can simply substract idle CPU usage from 1 (100%) and then multiply it by 100 to get percentage.
(
  1 -
  rate(
      node_cpu_seconds_total{mode="idle",instance="prometheus-training.balgroupit.com:9100"}[5m]
      )
)
* 100
Task 2.3.5: How much free memory
Arithmetic Binary Operator
can not only be used with constant values eg. 1, it can also be used to evaluate to other instant vectors.
Write a Query that returns how much of the memory is free in %.
The node exporter exposes these two metrics:
node_memory_MemTotal_bytesnode_memory_MemAvailable_bytes
Hints
We can simply divide the available memory metric by the total memory of the node and multiply it by 100 to get percent.
sum by(instance) (node_memory_MemAvailable_bytes{instance="prometheus-training.balgroupit.com:9100"})
/
sum by(instance) (node_memory_MemTotal_bytes{instance="prometheus-training.balgroupit.com:9100"})
* 100
Task 2.3.6: Comparison Binary Operators
In addition to the Arithmetic Binary Operator, PromQL also provides a set of Comparison binary operators
==(equal)!=(not-equal)>(greater-than)<(less-than)>=(greater-or-equal)<=(less-or-equal)
Check if the server has more than 20% memory available using a Comparison binary operators
Hints
We can simply use the greater-than-binary operator to compare the instant vector from the query with 20 (In our case, this corresponds to 20% memory usage).
sum by(instance) (node_memory_MemAvailable_bytes{instance="prometheus-training.balgroupit.com:9100"})
/
sum by(instance) (node_memory_MemTotal_bytes{instance="prometheus-training.balgroupit.com:9100"})
* 100
> 20
The query only has a result when more than 20% of the memory is available.
Change the value from 20 to 90 or more to see the result, when the operator doesn’t match.
Task 2.3.7: Histogram (optional)
So far we’ve been using gauge and counter metric types in our queries.
Read the documentation
about the histogram metric type.
There exists a histogram for the http request durations to the Prometheus sever. It basically counts requests that took a certain amount of time and puts them into matching buckets (le label).
We want to write a query that returns
- the total numbers of requests
- to the Prometheus server
- on
/metrics - below 0.1 seconds
Hints
A metric name has an application prefix
relevant to the domain the metric belongs to. The prefix is sometimes referred to as namespace by client libraries.
As seen in previous labs, the http metrics for the Prometheus server are available in the prometheus_ namespace.
By filtering the le label to 0.1 we get the result for our query.
prometheus_http_request_duration_seconds_bucket{handler="/metrics",le="0.1",namespace="<team>-monitoring"}
Tip: Analyze the query in PromLens
Advanced: You can calculate how many requests in % were below 0.1 seconds by aggregating above metric. See more information about Apdex score at Prometheus documentation
Example
sum(
  rate(
    prometheus_http_request_duration_seconds_bucket{handler="/metrics",le="0.1",namespace="<team>-monitoring"}[5m]
  )
) by (job, handler)
/
sum(
  rate(
    prometheus_http_request_duration_seconds_count{handler="/metrics",namespace="<team>-monitoring"}[5m]
  )
) by (job, handler)
* 100
Task 2.3.8: Quantile (optional)
We can use the histogram_quantile
function to calculate the request duration quantile of the requests to the Prometheus server from a histogram metric. To archive this we can use the metric prometheus_http_request_duration_seconds_bucket, which the Prometheus server exposes by default.
Write a query, that returns the per-second average of the 0.9th quantile under the metrics handler using the metric mentioned above.
Hints
Expression
histogram_quantile(
  0.9,
  rate(
    prometheus_http_request_duration_seconds_bucket{handler="/metrics",namespace="<team>-monitoring"}[5m]
  )
)
Explanation: histogram_quantile will calculate the 0.9 quantile based on the samples distribution in our buckets by assuming a linear distribution within a bucket.
Task 2.3.9: predict_linear function (optional)
We could simply alert on static thresholds. For example, notify when the file system is more than 90% full. But sometimes 90% disk usage is a desired state. For example, if our volume is very large. (e.g. 10% of 10TB would still be 1TB free, who wants to waste that space?) So it is better to write queries based on predictions. Say, a query that tells me that my disk will be full within the next 24 hours if the growth rate is the same as the last 6 hours.
Let’s write a query, that exactly makes such predictions:
- Find a metric that displays you the available disk space on filesystem mounted on
/ - Use a function that allows you to predict when the filesystem will be full in 4 hours
- Predict the usage linearly based on the growth over the last 1 hour
Hints
Expression
predict_linear(node_filesystem_avail_bytes{mountpoint="/",instance="prometheus-training.balgroupit.com:9100"}[1h], 3600 * 4) < 0
Explanation: based on data over the last 1h, the disk will be < 0 bytes in 3600 * 4 seconds.
The query will return no data because the file system will not be full in the next 4 hours. You can check how much disk space will be available in 4 hours by removing the < 0 part.
predict_linear(node_filesystem_avail_bytes{mountpoint="/",instance="prometheus-training.balgroupit.com:9100"}[1h], 3600 * 4)
Task 2.3.10: Many-to-one vector matches (optional)
Prometheus provides built-in metrics that can be used to correlate their values with metrics exposed by your exporters. One such metric is date().
Prometheus also allows you to add more labels from different metrics if you can correlate both metrics by labels. See Many-to-one and one-to-many vector matches
for more examples.
Write a query that answers the following questions:
- What is the uptime of the server in minutes?
- Which kernel is currently active?
Hints
Expression
(
  (
    time() - node_boot_time_seconds{instance="prometheus-training.balgroupit.com:9100"}
  ) / 60
)
* on(instance) group_left(release) node_uname_info
- time(): Use the current UNIX Epoch time
- node_boot_time_seconds: Returns the UNIX epoch time at which the VM was started
- on(instance) group_left(release) node_uname_info: Group your metrics result with the metric
node_uname_infowhich contains information about your kernel in thereleaselabel.
Alternative solution with group_right instead of group_left would be:
node_uname_info{instance="prometheus-training.balgroupit.com:9100"} * on(instance) group_right(release)
(
  (
    time() - node_boot_time_seconds
  ) / 60
)
3. Visualization
Our goal with this lab is to give you a brief overview how to visualize your Prometheus time series produced in the previous labs. For a more detailed tutorial, please refer to the Grafana tutorials .
Grafana is already provided in your Stack. Login to your Grafana instance on http://LOCALHOST_GRAFANA/ . Use your personal credentials to log in to Grafana.
Useful links and guides
3.1 Tasks: Grafana intro
Task 3.1.1 Have a look at the default team dashboard
The Monitoring Stack provides a dashboard that shows you common aggregated metrics of your applications. You should see the dashboard as soon as you log in.
Have a look at the provided dashboard .
- Select either the cluster
caast01orcaasp01to get metrics from applications running on these clusters
Task 3.1.2 Have a look at the default team namespace dashboard
The Monitoring Stack provides a dashboard that shows you metrics of your applications.
Navigate to Dashboards (Icon with the four squares on the left navigation menu)
The dashboard can be found under the name
Openshift Namespace DashboardSelect metrics about your
prometheuscontainer- running on the
caasi01cluster
3.2 Tasks: Grafana dashboards
Task 3.2.1: Import a dashboard
As a first Task we import an existing dashboard to our grafana. There is a huge collection of predefined dashboards available on https://grafana.com/grafana/dashboards .
In this task we learn how to import existing dashboards, which we can also use as reference to write our own queries and dashboards.
Choose one or more of the preexisting dashboards from https://grafana.com/grafana/dashboards
and import them into your grafana. Use the daterange, interval picker on the top right to change the timerange (between 5 minutes and 10 minutes) of the displayed mertics.
Note
You can import for example the Node Exporter Full dashboard, which will present you useful metrics about your linux servers
Hints
- Navigate to https://grafana.com/grafana/dashboards/1860-node-exporter-full/ and download the JSON
- On your Grafana web UI
- Navigate to Dashboards (Icon with the four squares on the left navigation menu) > New > Import
- Paste the contents of the downloaded JSON into the Import via panel json field
- Hit Load
- Choose your thanos-querier data source and hit Import
- Open the dashboard time control (to the upper right)
- Set From to
now-10m - Set To to
now-5m - Hit Apply time range
- Set From to
Task 3.2.2: Create your first dashboard
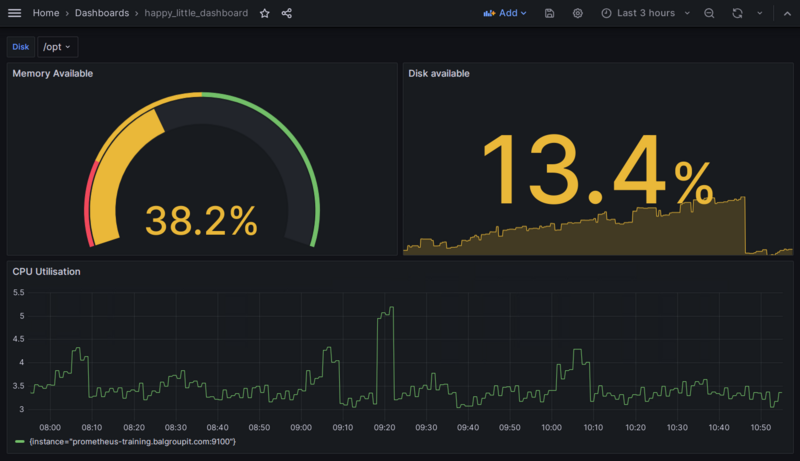
In this task you’re going to create your first own dashboard happy_little_dashboard. You will add the panel CPU Utilisation based on the following query:
100 - (
  avg by (instance) (rate(node_cpu_seconds_total{mode="idle",instance="prometheus-training.balgroupit.com:9100"}[5m]))
  * 100
)
Hints
- Navigate to Dashboards (Icon with the four squares on the left navigation menu)> New > New Dashboard
- Select Add visualization
- Select the thanos-querier data source
- In general, metrics can be built using the Grafana Query Builder or using “plain” PromQL queries. You can easily switch between these two at the top right of the query window. Going forward, we will use plain PromQL queries.
- Add the expression from above into the text field right next to the Metrics Browser dropdown
- Set the panel title to
CPU Utilisationunder Panel options > Title (you may need to open the options pane with the < button on the right hand side just below the Apply button) - Save the dashboard and give it the name
happy_little_dashboard
Task 3.2.3: Add a Gauge panel to the dashboard
Task description:
Add another panel to the existing happy_little_dashboard with the panel name Memory Available. Display the following query:
(1 - (
  sum by(instance) (node_memory_MemFree_bytes{instance="prometheus-training.balgroupit.com:9100"}
  +
  node_memory_Cached_bytes{instance="prometheus-training.balgroupit.com:9100"}
  +
  node_memory_Buffers_bytes{instance="prometheus-training.balgroupit.com:9100"}
)
)
/
  sum by(instance) (node_memory_MemTotal_bytes{instance="prometheus-training.balgroupit.com:9100"}))
* 100
Also, change the panel type to Gauge and display it in %. Define the following thresholds:
0% (red)
20% (orange)
50% (green)
Hints
- Hit Add (top navigation menu) > Visualization
- Select the thanos-querier data source
- Add the expression from above into the text field right next to the Metrics Browser dropdown
- Set the panel title to
Memory Availableunder Panel options > Title (you may need to open the options pane with the < button on the right hand side just below the Apply button)
- Define unit under Standard options > Unit > Misc / Percent (0-100)
- Choose Gauge in the dropdown menu just below the Apply button
- Add
20and50thresholds under Thresholds- Choose Red for Base
- Choose Orange for 20
- Choose Green for 50
- Save the dashboard
Task 3.2.4: Add a Stat panel that uses a variable to the dashboard
Add another panel to the existing happy_little_dashboard with the panel name Disk Available that uses a variable. Name the variable disk and label it Select disk. To calculate the available disk space of a certain mountpoint in percent, use the following query:
100 - ((node_filesystem_avail_bytes{mountpoint="$disk", instance="prometheus-training.balgroupit.com:9100"} * 100) / node_filesystem_size_bytes{mountpoint="$disk", instance="prometheus-training.balgroupit.com:9100"})
Also, change the panel type to Stat and display the value in %. Define the following thresholds:
0% (red)
10% (orange)
25% (green)
Hints
- First, we create the variable. Hit the little gear icon on the top right corner of the dashboard
- Select Variables in the menu on the left > Add Variable
- As we want the available values for the variable to be calculated dynamically, we will use a PromQL query for this as well. Thus, choose Query in the dropdown menu for
variable type - Set
Nametodisk - Set
LabeltoSelect disk - Select the thanos-querier data source
- Set
Query TypetoLabel values - Choose the label
mountpoint - As we are only interested in the mountpoint label of our linux VM, enter the metric
node_filesystem_avail_bytes{instance="prometheus-training.balgroupit.com:9100"} - The preview at the bottom should now already show the different mountpoints of the server
- Leave everything else as is, apply and navigate back to the dashboard
- Now, let’s use the variable in a new panel. Hit Add (top navigation menu) > Visualization
- Select the thanos-querier data source
- Add the query
100 - ((node_filesystem_avail_bytes{mountpoint="$disk", instance="prometheus-training.balgroupit.com:9100"} * 100) / node_filesystem_size_bytes{mountpoint="$disk", instance="prometheus-training.balgroupit.com:9100"})to the Metrics browser field - Set the panel title to
Disk Availableunder Panel options > Title (you may need to open the options pane with the < button on the right hand side just below the Apply button) - Define unit under Standard options > Unit > Misc / Percent (0-100)
- Choose Stat in the dropdown menu just below the Apply button
- Add
10and25thresholds under Thresholds- Choose Red for Base
- Choose Orange for 10
- Choose Green for 25
- Save the dashboard
If everything went well, depending on the formatting you chose, the dashboard should look something like this:
Task 3.2.4: Save your dashboard to GIT
The dashboards will only be persisted in your GIT repo. Manually clicked dashboards get deleted everytime Grafana restarts. Therefore, let us make sure that your dashboard will not be lost.
- Save your dashboard to your monitoring directory
- Follow the following documentation
Hints
- On your Grafana web UI
- Navigate to your Dashboard
happy_little_dashboard - Select Dashboard settings (Icon on the top navigation menu that looks like a gear)
- Select <> JSON Model
- Copy the JSON content and save the file
training_dashboard.yamlin the monitoring folder:
- Navigate to your Dashboard
apiVersion: v1
kind: ConfigMap
metadata:
  labels:
    dashboard: <team>-infra
  name: training-dashboard
data:
  training-dashboard.json: |-
    {
      Your dashboard JSON definition
    }
Note
Pay attention to YAML syntax, especially indentation.
  training-dashboard.json: |-
    {
      "annotations": {
        "list": [
          {
...
To ensure that the dashboard provisioning works as specified, try deleting the dashboard using the Grafana user interface.
- On your Grafana web UI
- Navigate to your Dashboard
happy_little_dashboard - Select Dashboard settings (Icon on the top navigation menu that looks like a gear)
- Click on Delete Dashboard
- Navigate to your Dashboard
You should see a warning message that prevents deleting provisioned dashboards.
4. Prometheus exporters
An increasing number of applications directly instrument a Prometheus metrics endpoint. This enables applications to be scraped by Prometheus out of the box. For all other applications, an additional component (the Prometheus exporter) is needed to close the gap between Prometheus and the application which should be monitored.
Note
There are lots of exporters available for many applications, such as MySQL/MariaDB, Nginx, Ceph, etc. Some of these exporters are maintained by the Prometheus GitHub organization while others are maintained by the community or third-party vendors. Check out the list of exporters on the Prometheus website for an up-to-date list of exporters.One example of a Prometheus exporter is the node_exporter we used in the second chapter of this training. This exporter collects information from different files and folders (e.g., /proc/net/arp, /proc/sys/fs/file-nr, etc.) and uses this information to create the appropriate Prometheus metrics.
In the tasks of this chapter we will configure two additional exporters.
Special exporters
Blackbox exporter
This is a classic example of a so-called multi-target exporter which uses relabeling to pass the targets to the exporter. This exporter is capable of probing the following endpoints:
- HTTP
- HTTPS
- DNS
- TCP
- ICMP
By using the TCP prober you can create custom checks for almost any service including services using STARTTLS. Check out the example.yml file in the project’s GitHub repository.
Prometheus Pushgateway
The Pushgateway allows jobs (e.g., Kubernetes Jobs or CronJobs) to push metrics to an exporter where Prometheus will collect them. This can be required since jobs only exist for a short amount of time and as a result, Prometheus would fail to scrape these jobs most of the time. In addition, it would require all these jobs to implement a webserver in order for Prometheus to collect the metrics.
Note
The Pushgateway should only be used for for this specific use case. It simply acts as cache for short-lived jobs and by default does not even have any persistence. It is not intended to convert Prometheus into a push-based monitoring system4.1 Tasks: Blackbox exporter
Task 4.1.1: Add a blackbox target
We will use the blackbox exporter to create a new probe which accepts a 2xx return code as a valid http return code. This will return the probe_success metric from the blackbox exporter with the value 1, if the http status code is 2xx.
Task description:
- Create a probe in the monitoring directory which uses the HTTP prober and expects a
2xxreturn code as a valid status code - Define
https://bitbucket.balgroupit.com/statusas a single static target, which the blackbox should probe - Use the following documentation as reference 06 - HTTP and TCP endpoint monitoring
Hints
To configure the blackbox exporter you have to add the following file training_blackbox_target.yaml to your monitoring directory, commit and push the changes:
apiVersion: monitoring.coreos.com/v1
kind: Probe
metadata:
  name: bitbucket-2xx
spec:
  module: http_2xx
  prober:
    url: blackbox:9115
  targets:
    staticConfig:
      static:
      - https://bitbucket.balgroupit.com/status
      labels:
        env: nonprod
You can simulate this by directly running a curl inside the prometheus pod on this URL. The probe_success metric should have the value 1.
Note
As you will be executing some oc commands in the following labs, make sure you are logged in to your OpenShift Cluster.
You can copy the login Command from the OpenShift UI:
- Browse to http://LOCALHOST_OPENSHIFT
- Click on your name in the top right
Copy login command- Replace
6443with443
oc -n <team>-monitoring exec prometheus-prometheus-0 -c prometheus-proxy -- \
curl blackbox:9115/probe?target=https://bitbucket.balgroupit.com/status&module=http_2xx
...
# HELP probe_success Displays whether or not the probe was a success
# TYPE probe_success gauge
probe_success 1
...
Warning
As you can see in the 06 - HTTP and TCP endpoint monitoring documentation, there are some modules pre-defined. You can directly use them as shown in the lab above.
If you have a custom use case, you can provide your own module as described in Custom modules.
Task 4.1.2: Query blackbox metrics
Let’s now create a query which selects all metrics belonging to the blackbox exporter target https://bitbucket.balgroupit.com/status and display them in the Thanos Querier UI
.
Hints
We can select all metrics for the target with the following query:
{instance="https://bitbucket.balgroupit.com/status"}
or directly navigate to your Thanos Querier
Warning
In the list of metrics you will find one metric with the name up. In the case of a multi-target exporter such as the blackbox exporter this metric will always be up as long as Prometheus is able to successfully scrape the exporter even if the actual target (website, TCP service, etc.) is down. To monitor the state of the targets always use the probe_success metric.
Task 4.1.3 (optional): Add a protocol label to your blackbox target
Add the new label protocol to every blackbox exporter target by updating the relabel config. The new label should contain the protocol (HTTP or HTTPS) extracted from the target URL.
Hints
To configure the blackbox exporter you have to updates the following file training_blackbox_target.yaml in your monitoring directory:
apiVersion: monitoring.coreos.com/v1
kind: Probe
metadata:
  name: bitbucket-2xx
spec:
  module: http_2xx
  prober:
    url: blackbox:9115
  targets:
    staticConfig:
      static:
      - https://bitbucket.balgroupit.com/status
      labels:
        env: nonprod
  metricRelabelings:
  - sourceLabels: [instance] #1
    targetLabel: protocol #2
    regex: '^(.+):.+' #3
    replacement: $1 #4
- 1: Use the value from the label
instance. This label contains all targets defined at.spec.targets.staticConfig.static - 2: We will call the new label
protocol - 3: Capture the first part of your url until
:. In our casehttpsfromhttps://bitbucket.balgroupit.com/status - 4: Replace
target_labelvalue with the regex match fromsource_labelsvalue
4.2 Tasks: Pushgateway
Note
As you will be executing some oc commands in the following labs, make sure you are logged in to your OpenShift Cluster.
You can copy the login Command from the OpenShift UI:
- Browse to http://LOCALHOST_OPENSHIFT
- Click on your name in the top right
Copy login command- Replace
6443with443
Task 4.2.2 - Push metrics to Pushgateway
In this task you’re going to push metrics to the Pushgateway. This is what you would normally do, after a cronjob has completed successfully.
Documentation on how the Pushgateway is implemented at Baloise can be found here: 07 - Push metrics to your Prometheus instance .
In order to push
metrics to the Pushgateway, you can simply send an HTTP POST or PUT request, with the actual metric we want to push as content.
When pushing metrics to the Pushgateway, you always have to specify the job, therefore the URL Path looks like this:
http://localhost:9091/metrics/job/<JOB_NAME>{/<LABEL_NAME>/<LABEL_VALUE>}
If we want to push the metric prometheus_training_labs_completed_total with the value 4 and the job prometheus_training to the Pushgateway, we can do that by creating the following Kubernetes Job:
oc -n <team>-monitoring create job --image=quay.balgroupit.com/library/toolkit:ubuntu-20.04 pushgw-example1 -- \
bash -c "echo 'prometheus_training_labs_completed_total 4' | curl --data-binary @- http://pushgateway.<team>-monitoring:9091/metrics/job/prometheus_training"
Command Explanation
If you are not very familiar with oc create job. The above command does the following:
oc -n ... create jobcreates an adhoc kubernetes job--image=specifies, which image the container will use. We will use the toolkit container because it provides bash and curl.pushgw-example1is the name of the jobbash -c "..."is the command, the job should execute
Verify the metric in the Prometheus web UI
. It may take up to 30s ( Depending on the scrape_interval) to be available in Prometheus.
Push
the following metric (notice the instance label) to the Pushgateway and make sure the metric gets scraped by Prometheus
# TYPE some_metric_total counter
# HELP This is just an example metric.
some_metric_total{job="prometheus_training",instance="myinstance"} 42
Hints
To push a metric to the Pushgateway, which will then be scraped by Prometheus, we can simply create the following job. Note the actual content of the HTTP request, is exactly the metric we want Prometheus to scrape.
Execute the following command to push the metric to your Pushgateway:
oc -n <team>-monitoring create job --image=quay.balgroupit.com/library/toolkit:ubuntu-20.04 pushgw-example2 -- \
bash -c "cat <<EOF | curl --data-binary @- http://pushgateway.<team>-monitoring:9091/metrics/job/prometheus_training/instance/myinstance
# TYPE some_metric_total counter
# HELP This is just an example metric.
some_metric_total 42
EOF"
Command Explanation
If you are not very familiar with the Linux shell, the above command does the following:
- the
catcommand reads the actual metric and pipes it tostdin - curl sends a HTTP POST request to the URL http://localhost:9091/metrics/job/prometheus_training/instance/myinstance
with the –data-binary parameter set to
stdin(the actual metric)
Verify the metric in the Prometheus web UI
. It may take up to 30s (depending on the scrape_interval) to be available in Prometheus.
Task 4.2.3 - Delete Pushgateway metrics
By sending HTTP delete requests to the same endpoint, we can delete metrics from the Pushgateway.
Note
Metrics pushed to the Pushgateway are not automatically purged until you manually delete them via the API or the process restarts. If you persist the metrics with--persistence.file, you should ensure that you have set up a job that cleans up the metrics on a regular basis.According to the official Pushgateway documentation you can delete either metrics for specific label combinations (exact match required) or all metrics.
Delete the pushed metrics from the Pushgateway.
Hints
To delete the metrics for the job prometheus_training, you can simply execute the following command:
oc -n <team>-monitoring create job --image=quay.balgroupit.com/library/toolkit:ubuntu-20.04 pushgw-delete -- \
curl -X DELETE http://pushgateway.<team>-monitoring:9091/metrics/job/prometheus_training
Note
This will delete metrics with the label set {job="prometheus_training"} but not {job="prometheus_training",another_label="value"} since the delete methode requires an exact label match.
The Pushgateway pod has no persistence, so you can delete all metrics stored in Pushgateway by deleting the pod.
oc -n <team>-monitoring delete pod -l app.kubernetes.io/component=pushgateway
Remove the created examples jobs.
oc -n <team>-monitoring delete jobs pushgw-delete pushgw-example1 pushgw-example2
4.3 Tasks: Exporter as a sidecar
Task 4.3.1: Deploy a database and use a sidecar container to expose metric
Task description:
As we’ve learned in Lab 4 - Prometheus exporters when applications do not expose metrics in the Prometheus format, there are a lot of exporters available to convert metrics into the correct format. In Kubernetes this is often done by deploying so called sidecar containers along with the actual application.
Use the following command to deploy a MariaDB database your monitoring or application namespace on CAAST.
Create the following deployment (training_baloise_mariadb-deployment.yaml)
apiVersion: apps/v1
kind: Deployment
metadata:
  name: mariadb
  labels:
    app: mariadb
spec:
  selector:
    matchLabels:
      app: mariadb
  strategy:
    type: Recreate
  template:
    metadata:
      labels:
        app: mariadb
    spec:
      containers:
        - image: quay.balgroupit.com/acend/mariadb:10.5
          name: mariadb
          args:
            - --ignore-db-dir=lost+found
          env:
            - name: MYSQL_USER
              valueFrom:
                secretKeyRef:
                  key: database-user
                  name: mariadb
            - name: MYSQL_PASSWORD
              valueFrom:
                secretKeyRef:
                  key: database-password
                  name: mariadb
            - name: MYSQL_ROOT_PASSWORD
              valueFrom:
                secretKeyRef:
                  key: database-root-password
                  name: mariadb
            - name: MYSQL_DATABASE
              valueFrom:
                secretKeyRef:
                  key: database-name
                  name: mariadb
          livenessProbe:
            tcpSocket:
              port: 3306
          ports:
            - containerPort: 3306
              name: mariadb
          volumeMounts:
            - mountPath: /var/lib/mysql
              name: data
      volumes:
        - name: data
          emptyDir: {}
Create the following secret (training_baloise_mariadb-secret.yaml)
apiVersion: v1
kind: Secret
metadata:
  name: mariadb
  labels:
    app: mariadb
data:
  database-name: YWNlbmRleGFtcGxlZGI= # example
  database-password: bXlzcWxwYXNzd29yZA== # example
  database-root-password: bXlzcWxyb290cGFzc3dvcmQ= # example
  database-user: YWNlbmQtdXNlcg== # example
Create the following service (training_baloise_mariadb-service.yaml)
apiVersion: v1
kind: Service
metadata:
  name: mariadb
  labels:
    app: mariadb
    prometheus-monitoring: 'true'
spec:
  ports:
    - name: mariadb
      port: 3306
      protocol: TCP
      targetPort: 3306
  selector:
    app: mariadb
This will create a Secret (username password to access the database), a Service and the Deployment .
- Deploy the mariadb exporter
from https://registry.hub.docker.com/r/prom/mysqld-exporter/
as a sidecar container
- Alter the existing MariaDB deployment definition to contain the side car
- Create a ServiceMonitor to instruct Prometheus to scrape the sidecar container
Hints
First we need to alter the MariaDB deployment training_baloise_mariadb-deployment.yaml by adding the MariaDB exporter as a second container.
apiVersion: apps/v1
kind: Deployment
metadata:
  name: mariadb
  labels:
    app: mariadb
spec:
  selector:
    matchLabels:
      app: mariadb
  strategy:
    type: Recreate
  template:
    metadata:
      labels:
        app: mariadb
    spec:
      containers:
        - image: quay.io/prometheus/mysqld-exporter:v0.14.0
          name: mariadb-exporter
          env:
            - name: MYSQL_USER
              valueFrom:
                secretKeyRef:
                  key: database-user
                  name: mariadb
            - name: MYSQL_PASSWORD
              valueFrom:
                secretKeyRef:
                  key: database-password
                  name: mariadb
            - name: MYSQL_ROOT_PASSWORD
              valueFrom:
                secretKeyRef:
                  key: database-root-password
                  name: mariadb
            - name: MYSQL_DATABASE
              valueFrom:
                secretKeyRef:
                  key: database-name
                  name: mariadb
            - name: DATA_SOURCE_NAME
              value: $(MYSQL_USER):$(MYSQL_PASSWORD)@(127.0.0.1:3306)/$(MYSQL_DATABASE)
          ports:
            - containerPort: 9104
              name: mariadb-exp
        - image: quay.balgroupit.com/acend/mariadb:10.5
          name: mariadb
          args:
            - --ignore-db-dir=lost+found
          env:
            - name: MYSQL_USER
              valueFrom:
                secretKeyRef:
                  key: database-user
                  name: mariadb
            - name: MYSQL_PASSWORD
              valueFrom:
                secretKeyRef:
                  key: database-password
                  name: mariadb
            - name: MYSQL_ROOT_PASSWORD
              valueFrom:
                secretKeyRef:
                  key: database-root-password
                  name: mariadb
            - name: MYSQL_DATABASE
              valueFrom:
                secretKeyRef:
                  key: database-name
                  name: mariadb
          livenessProbe:
            tcpSocket:
              port: 3306
          ports:
            - containerPort: 3306
              name: mariadb
          volumeMounts:
            - mountPath: /var/lib/mysql
              name: data
      volumes:
        - name: data
          emptyDir: {}
Then extend the service training_baloise_mariadb-service.yaml by adding a second port for the MariaDB exporter.
apiVersion: v1
kind: Service
metadata:
  name: mariadb
  labels:
    app: mariadb
    prometheus-monitoring: 'true'
spec:
  ports:
    - name: mariadb
      port: 3306
      protocol: TCP
      targetPort: 3306
    - name: mariadb-exp
      port: 9104
      protocol: TCP
      targetPort: 9104
  selector:
    app: mariadb
Then we also need to create a new ServiceMonitor training_baloise_mariadb-servicemonitor.yaml.
---
apiVersion: monitoring.coreos.com/v1
kind: ServiceMonitor
metadata:
  labels:
    app.kubernetes.io/name: mariadb
  name: mariadb
spec:
  endpoints:
    - interval: 60s
      port: mariadb-exp
      scheme: http
      path: /metrics
  selector:
    matchLabels:
      prometheus-monitoring: 'true'
Verify that the target gets scraped in the Prometheus user interface
. Target name: serviceMonitor/<team>-monitoring/mariadb/0 (It may take up to a minute for Prometheus to load the new configuration and scrape the metrics).
Task 4.3.2: generic-chart MariaDB deployment (optional)
Task description:
- Deploy the mariadb exporter from quay.io/prometheus/mysqld-exporter as a sidecar container.
- Define all parameters using the generic-chart .
Hints
Create an application on CAAST and deploy the following configuration.
Chart.yaml:
apiVersion: v2
name: example-mariadb
version: 1.0.0
dependencies:
  - name:  generic-chart
    version: 3.13.1
    repository: https://charts.shapp.os1.balgroupit.com/shared/release/
alias: example-mariadbvalues.yaml:
example-mariadb:
  replicaCount: 1
  image:
    repository: quay.balgroupit.com/acend/mariadb
    tag: 10.5
  additionalContainers:
    - name: "mariadb-exporter"
      image: quay.io/prometheus/mysqld-exporter:v0.14.0
      env:
        - name: MYSQL_USER
          valueFrom:
            secretKeyRef:
              key: database-user
              name: mariadb
        - name: MYSQL_PASSWORD
          valueFrom:
            secretKeyRef:
              key: database-password
              name: mariadb
        - name: MYSQL_ROOT_PASSWORD
          valueFrom:
            secretKeyRef:
              key: database-root-password
              name: mariadb
        - name: MYSQL_DATABASE
          valueFrom:
            secretKeyRef:
              key: database-name
              name: mariadb
        - name: DATA_SOURCE_NAME
          value: $(MYSQL_USER):$(MYSQL_PASSWORD)@(127.0.0.1:3306)/$(MYSQL_DATABASE)
  network:
    mariadb-exp:
      servicePort: 9104
      serviceMonitor: {}
    mariadb:
      servicePort: 3306
  env:
    - name: MYSQL_USER
      valueFrom:
        secretKeyRef:
          key: database-user
          name: mariadb
    - name: MYSQL_PASSWORD
      valueFrom:
        secretKeyRef:
          key: database-password
          name: mariadb
    - name: MYSQL_ROOT_PASSWORD
      valueFrom:
        secretKeyRef:
          key: database-root-password
          name: mariadb
    - name: MYSQL_DATABASE
      valueFrom:
        secretKeyRef:
          key: database-name
          name: mariadb
  volumes:
    - name: data
      emptyDir: {}
  volumeMounts:
    - mountPath: /var/lib/mysql
name: datatemplates/secret.yaml:
apiVersion: v1
kind: Secret
metadata:
  name: mariadb
  labels:
    app: mariadb
data:
  database-name: YWNlbmRleGFtcGxlZGI= # example
  database-password: bXlzcWxwYXNzd29yZA== # example
  database-root-password: bXlzcWxyb290cGFzc3dvcmQ= # example
  database-user: YWNlbmQtdXNlcg== # example
Verify that the target gets scraped in the Prometheus user interface
. Target name: application-metrics/mariadb/0 (it may take up to a minute for Prometheus to load the new configuration and scrape the metrics).
Make sure to remove the files Chart.yaml, values.yaml and templates/secret.yaml once finished.
5. Prometheus in Kubernetes
Baloise Monitoring Stack
Have a look at the Baloise Monitoring Stack and take a look at the different components and how they work together.
You will notice that each Team Monitoring Stack has components on all clusters it is included in. The metrics scraped by the Team Monitoring Stack are not shared by default. However, you can provide your Prometheus time series to other monitoring stacks .
kube-prometheus
The Baloise Monitoring Stack stack already provides an extensive Prometheus setup and contains a set of default alerts and dashboards. The following targets will be available.
kube-state-metrics: Exposes metadata information about Kubernetes resources. Used, for example, to check if resources have the expected state (deployment rollouts, pods CrashLooping) or if jobs fail.
# Example metrics
kube_deployment_created
kube_deployment_spec_replicas
kube_daemonset_status_number_misscheduled
...
cAdvisor: cAdvisor exposes usage and performance metrics about running container. Commonly used to observe memory usage or CPU throttling .
# Example metrics
container_cpu_cfs_throttled_periods_total
container_memory_working_set_bytes
container_fs_inodes_free
...
kubelet: Exposes general kubelet related metrics. Used to observe if the kubelet and the container engine is healthy.
# Example metrics
kubelet_runtime_operations_duration_seconds_bucket
kubelet_runtime_operations_total
...
probes: Expose metrics about Kubernetes liveness, readiness and startup probes
Normally you would not alert on Kubernetes probe metrics, but on container restarts exposed by kube-state-metrics.
# Example metrics
prober_probe_total{probe_type="Liveness", result="successful",...}
prober_probe_total{probe_type="Startup", result="successful",...}
...
blackbox-exporter: Exposes default metrics from blackbox-exporter. Can be customized using the Probe custom resource.
# Example metrics
probe_http_status_code
probe_http_duration_seconds
...
alertmanager-main/grafana/prometheus-k8s/prometheus-operator/prometheus-adapter: Exposes all monitoring stack component metrics.
# Example metrics
alertmanager_alerts_received_total
alertmanager_config_last_reload_successful
...
grafana_build_info
grafana_datasource_request_total
...
prometheus_config_last_reload_successful
prometheus_rule_evaluation_duration_seconds
...
prometheus_operator_reconcile_operations_total
prometheus_operator_managed_resources
...
pushgateway: Exposes metrics pushed to your pushgateway.
# Example metrics
pushgateway_build_info
pushgateway_http_requests_total
...
Vault: Exposes metrics from your vaults instance.
# Example metrics
vault_autopilot_healthy
vault_core_unsealed
...
Jenkins: Exposes metrics from your Jenkins instance.
# Example metrics
jenkins_builds_duration_milliseconds_summary_count
jenkins_executors_available
...
Argo CD: Exposes metrics from your Argo CD instance.
# Example metrics
argocd_app_info{sync_status="Synced", health_status="Healthy", ...}
argocd_app_sync_total
...
5.1 Tasks: kube-prometheus metrics
Task 5.1.1: Memory usage of Prometheus
Task description:
- Display the memory usage of both Prometheus pods
- Use a filter to just display metrics from your
prometheuscontainers
Note
Search for a metric withmemory_working_set in its nameHints
container_memory_working_set_bytes{namespace="<user>-monitoring", pod=~"prometheus-prometheus-.*", container="prometheus"}
Task 5.1.2: Kubernetes pod count
Task description:
- Display how many pods are currently running on your Kubernetes platform
Hints
There are different ways to archive this. You can for example query all running containers and group them by pod and namespace.
count(sum(kube_pod_container_status_running == 1) by (pod,namespace,cluster))
You may also sum() all running pods on your Kubernetes nodes
sum(kubelet_running_pods)
Note
The result counts only the pods on the clusters that you actually use. Therefore, this number may be different for each monitoring stack. There may be a minor discrepancy between the two options, as the platform is constantly changing and different jobs query the targets at different times.
6. Instrumenting with client libraries
While an exporter is an adapter for your service to adapt a service specific value into a metric in the Prometheus format, it is also possible to export metric data programmatically in your application code.
Client libraries
The Prometheus project provides client libraries which are either official or maintained by third-parties. There are libraries for all major languages like Java, Go, Python, PHP, and .NET/C#.
Even if you don’t plan to provide your own metrics, those libraries already export some basic metrics based on the language. For Go , default metrics about memory management (heap, garbage collection) and thread pools can be collected. The same applies to Java .
Specifications and conventions
Application metrics or metrics in general can contain confidential information, therefore endpoints should be protected from unauthenticated users. This can be achieved either by exposing the metrics on a different port, which is only reachable by Prometheus or by protecting the metrics endpoints with some sort of authentication.
There are some guidelines and best practices how to name your own metrics. Of course, the specifications of the datamodel must be followed and applying the best practices about naming is not a bad idea. All those guidelines and best practices are now officially specified in openmetrics.io .
Following these principles is not (yet) a must, but it helps to understand and interpret your metrics.
Best practices
Though implementing a metric is an easy task from a technical point of view, it is not so easy to define what and how to measure. If you follow your existing log statements and if you define an error counter to count all errors and exceptions , then you already have a good base to see the internal state of your application.
The four golden signals
Another approach to define metrics is based on the four golden signals :
- Latency
- Traffic
- Errors
- Saturation
There are other methods like RED or USE that go into the same direction.
Collecting Application Metrics
When running applications in production, a fast feedback loop is a key factor. The following reasons show why it’s essential to gather and combine all sorts of metrics when running an application in production:
- To make sure that an application runs smoothly
- To be able to see production issues and send alerts
- To debug an application
- To take business and architectural decisions
- Metrics can also help to decide when to scale applications
6.1 Tasks: Instrumenting
Task 6.1.1: Spring Boot Example Instrumentation
Using the micrometer metrics facade in Spring Boot Applications lets us collect all sort of metrics within a Spring Boot application. Those metrics can be exported for Prometheus to scrape by a few additional dependencies and configuration.
Let’s have a deeper look at how the instrumentation of a Spring Boot application works. For that we can use the prometheus-training-spring-boot-example application located at https://github.com/acend/prometheus-training-spring-boot-example
. To make the application collect metrics and provide a Prometheus endpoint we now need to simply add the following two dependencies in the pom.xml file, where it says <!-- Add Dependencies here-->:
Note
For your convenience, the changes mentioned below are already implemented in thesolution subfolder of the git repository. You therefore do not have to make any changes in the code. ....
<dependency>
<groupId>org.springframework.boot</groupId>
<artifactId>spring-boot-starter-actuator</artifactId>
</dependency>
<dependency>
<groupId>io.micrometer</groupId>
<artifactId>micrometer-registry-prometheus</artifactId>
<scope>runtime</scope>
</dependency>
....
Additionally to those dependencies we also need to configure the metrics endpoints to be exposed.
This can be done in the file src/main/resources/application.properties by adding the following line:
management.endpoints.web.exposure.include=prometheus,health,info,metric
As mentioned above, these changes have already been implemented in the solution subfolder of the repository. A pre-built docker image is also available under https://quay.io/repository/acend/prometheus-training-spring-boot-example?tab=tags
.
Note
In the next step we will deploy our application to our OpenShift Cluster for demonstration purposes in our monitoring namespace. This should never be done for production use cases. If you are familiar with deploying on OpenShift, you can complete this lab by deploying the application on our test cluster.- Add the following resource
training_springboot_example.yamlto your monitoring directory, commit and push your changes.
---
apiVersion: apps/v1
kind: Deployment
metadata:
  labels:
    app: example-spring-boot
  name: example-spring-boot
spec:
  replicas: 1
  selector:
    matchLabels:
      app: example-spring-boot
  template:
    metadata:
      labels:
        app: example-spring-boot
    spec:
      containers:
      - image: quay.balgroupit.com/acend/prometheus-training-spring-boot-example:latest
        imagePullPolicy: Always
        name: example-spring-boot
      restartPolicy: Always
---
apiVersion: v1
kind: Service
metadata:
  name: example-spring-boot
  labels:
    app: example-spring-boot
spec:
  ports:
    - name: http
      port: 8080
      protocol: TCP
      targetPort: 8080
  selector:
    app: example-spring-boot
  type: ClusterIP
---
apiVersion: monitoring.coreos.com/v1
kind: ServiceMonitor
metadata:
  labels:
    app.kubernetes.io/name: example-spring-boot
  name: example-spring-boot-monitor
spec:
  selector:
    matchLabels:
      app: example-spring-boot
  endpoints:
  - interval: 30s
    port: http
    scheme: http
    path: /actuator/prometheus
Note
This will create aDeployment, a Service and a ServiceMonitor resource in our monitoring namespace. We will learn about ServiceMonitors later in labs 8. For now, we only need to know, that a ServiceMonitor resource will configure Prometheus targets based on the pods linked to the service.Verify in the web UI whether the target has been added and is scraped. This might take a while until the target appears.
And you should also be able to find your custom metrics:
{job="example-spring-boot"}
Explore the spring boot metrics.
Task 6.1.2: Metric names
Study the following metrics and decide if the metric name is ok
http_requests{handler="/", status="200"}

http_request_200_count{handler="/"}

go_memstats_heap_inuse_megabytes{instance="localhost:9090",job="prometheus"}

prometheus_build_info{branch="HEAD",goversion="go1.15.5",instance="localhost:9090",job="prometheus",revision="de1c1243f4dd66fbac3e8213e9a7bd8dbc9f38b2",version="2.32.1"}

prometheus_config_last_reload_success_timestamp{instance="localhost:9090",job="prometheus"}

prometheus_tsdb_lowest_timestamp_minutes{instance="localhost:9090",job="prometheus"}
Hints
The
_totalsuffix should be appended, sohttp_requests_total{handler="/", status="200"}is better.There are two issues in
http_request_200_count{handler="/"}: The_countsuffix is foreseen for histograms, counters can be suffixed with_total. Second, status information should not be part of the metric name, a label{status="200"}is the better option.The base unit is
bytesnotmegabytes, sogo_memstats_heap_inuse_bytesis correct.Everything is ok with
prometheus_build_infoand its labels. It’s a good practice to export such base information with a gauge.In
prometheus_config_last_reload_success_timestamp, the base unit is missing, correct isprometheus_config_last_reload_success_timestamp_seconds.The base unit is
secondsfor timestamps, soprometheus_tsdb_lowest_timestamp_secondsis correct.
Task 6.1.3: Metric names (optional)
What kind of risk do you have, when you see such a metric
http_requests_total{path="/etc/passwd", status="404"} 1
Hints
There is no potential security vulnerability from exposing the /etc/passwd path, which seems to be handled appropriately in this case: no password is revealed.
From a Prometheus point of view, however, there is the risk of a DDoS attack: An attacker could easily make requests to paths which obviously don’t exist. As every request and therefore path is registered with a label, many new time series are created which could lead to a cardinality explosion and finally to out-of-memory errors.
It’s hard to recover from that!
For this case, it’s better just to count the 404 requests and to lookup the paths in the log files.
http_requests_total{status="404"} 15
Task 6.1.4: Custom metric (optional)
In this lab you’re going to create your own custom metric in the java Spring Boot application.
Note
This tasks requires that you have docker and git installed on your local machine. This counter is just a simple example for the sake of this lab. Those kind of metrics are provided by the micrometer Prometheus Spring Boot integration out of the box.First we need to clone the repository to our local machine:
git clone https://github.com/acend/prometheus-training-spring-boot-example && \
cd prometheus-training-spring-boot-example && \
git checkout baloise
and then configure the dependencies and application.properties as described in Task 6.1.1.
Next, create a new CustomMetrics RestController class in your Spring Boot application src/main/java/ch/acend/prometheustrainingspringbootexample/CustomMetricController.java:
package ch.acend.prometheustrainingspringbootexample;

import org.springframework.beans.factory.annotation.Autowired;
import org.springframework.web.bind.annotation.GetMapping;
import org.springframework.web.bind.annotation.RequestMapping;
import org.springframework.web.bind.annotation.ResponseStatus;
import org.springframework.web.bind.annotation.RestController;

import io.micrometer.core.instrument.Counter;
import io.micrometer.core.instrument.MeterRegistry;

@RestController
public class CustomMetricController {

    private final Counter myCounter;
    private final MeterRegistry meterRegistry;

    @Autowired
    public CustomMetricController(MeterRegistry meterRegistry) {
        this.meterRegistry = meterRegistry;
        this.myCounter = meterRegistry.counter("my.prometheus.instrumentation.counter");
    }

    @GetMapping(value = "/api")
    public String getAll() {
        myCounter.increment();
        return "ok";
    }
}
We register our custom counter myCounter on the MeterRegistry in the constructor of the RestController.
Then we simply increase the counter every time the endpoint /api is hit. (just an example endpoint)
To build the application we will use the Dockerfile provided in the root folder of the repository.
docker build -t prometheus-training-spring-boot-example:local .
Start the Spring Boot application:
docker run --rm -p 8080:8080 prometheus-training-spring-boot-example:local
Let’s create a couple of requests to our new endpoint, make sure to run those commands from a second terminal window, while the Spring Boot application is still running.
curl http://localhost:8080/api
Then verify the Prometheus metrics endpoint and look for a metric with the name my_prometheus_instrumentation_counter_total
curl http://localhost:8080/actuator/prometheus
Expected result:
...
# HELP my_prometheus_instrumentation_counter_total
# TYPE my_prometheus_instrumentation_counter_total counter
my_prometheus_instrumentation_counter_total 1.0
# HELP tomcat_sessions_rejected_sessions_total
# TYPE tomcat_sessions_rejected_sessions_total counter
tomcat_sessions_rejected_sessions_total 0.0
# HELP jvm_threads_peak_threads The peak live thread count since the Java virtual machine started or peak was reset
...
7. Alerting with Alertmanager
Installation
Setup
At Baloise the Alertmanger is part of the managed monitoring stack and does not need to be installed. We will have a look at the default configuration in the next chapter.
Configuration in Alertmanager
Alertmanager’s configuration is done using a YAML config file. There are two main sections for configuring how Alertmanager is dispatching alerts: receivers and routing.
Receivers
With a receiver , one or more notifications can be defined. There are different types of notifications types, e.g. mail, webhook, or one of the message platforms like Slack or PagerDuty.
Routing
With routing blocks , a tree of routes and child routes can be defined. Each routing block has a matcher which can match one or several labels of an alert. Per block, one receiver can be specified, or if empty, the default receiver is taken.
amtool
As routing definitions might be very complex and hard to understand, amtool becomes handy as it helps to test the rules. It can also generate test alerts and has even more useful features. More about this in the labs.
Default Configuration
Alertmanager’s configuration is managed by the monitoring stack. Take a look at the default configuration in use at Baloise:
# baloise config
global:
  resolve_timeout: 5m
  http_config:
    follow_redirects: true
  smtp_from: devops@example.com
  smtp_hello: localhost
  smtp_smarthost: smtp.example.com:25
  smtp_require_tls: false
route:
  receiver: default
  group_by:
  - namespace
  - alertname
  continue: false
  routes:
  - receiver: mail-critical
    match_re:
      severity: critical|warning
    continue: true
  - receiver: deadmanswitch
    match_re:
      alertname: DeadMansSwitch
    continue: false
    group_wait: 0s
    group_interval: 5s
    repeat_interval: 1m
  - receiver: teams-critical-prod
    matchers:
    - env="prod"
    - severity="critical"
    continue: false
  - receiver: teams-warning-prod
    matchers:
    - env="prod"
    - severity="warning"
    continue: false
  - receiver: teams-info-prod
    matchers:
    - env="prod"
    continue: false
  - receiver: teams-critical-nonprod
    matchers:
    - env!="prod"
    - severity="critical"
    continue: false
  - receiver: teams-warning-nonprod
    matchers:
    - env!="prod"
    - severity="warning"
    continue: false
  - receiver: teams-info-nonprod
    matchers:
    - env!="prod"
    - severity="info"
    continue: false
  - receiver: teams-warning-prod
    matchers:
    - env!="prod"
    continue: false
  group_wait: 30s
  group_interval: 1m
  repeat_interval: 12h
inhibit_rules:
- source_match:
    severity: critical
  target_match_re:
    severity: warning|info
  equal:
  - namespace
  - alertname
- source_match:
    severity: warning
  target_match_re:
    severity: info
  equal:
  - namespace
  - alertname
receivers:
- name: default
- name: mail-critical
  email_configs:
  - send_resolved: false
    to: group.devops_system@example.com
    from: devops@example.com
    hello: localhost
    smarthost: smtp.example.com:25
    headers:
      From: devops@example.com
      Subject: '{{ template "email.default.subject" . }}'
      To: group.devops_system@example.com
    html: '{{ template "email.default.html" . }}'
    require_tls: false
- name: teams-critical-prod
  webhook_configs:
  - send_resolved: true
    http_config:
      follow_redirects: true
    url: http://localhost:8089/v2/critical
    max_alerts: 0
- name: teams-warning-prod
  webhook_configs:
  - send_resolved: true
    http_config:
      follow_redirects: true
    url: http://localhost:8089/v2/warning
    max_alerts: 0
- name: teams-info-prod
  webhook_configs:
  - send_resolved: true
    http_config:
      follow_redirects: true
    url: http://localhost:8089/v2/info
    max_alerts: 0
- name: teams-critical-nonprod
  webhook_configs:
  - send_resolved: true
    http_config:
      follow_redirects: true
    url: http://localhost:8090/v2/critical
    max_alerts: 0
- name: teams-warning-nonprod
  webhook_configs:
  - send_resolved: true
    http_config:
      follow_redirects: true
    url: http://localhost:8090/v2/warning
    max_alerts: 0
- name: teams-info-nonprod
  webhook_configs:
  - send_resolved: true
    http_config:
      follow_redirects: true
    url: http://localhost:8090/v2/info
    max_alerts: 0
- name: deadmanswitch
  webhook_configs:
  - send_resolved: false
    http_config:
      follow_redirects: true
    url: http://deadmanswitch:8080/ping/...
    max_alerts: 0
templates: []
More (advanced) options
For more insights of the configuration options, study the following resources:
- Example configuration provided by Alertmanager on GitHub
- General overview of Alertmanager
Alerting rules in Prometheus
Prometheus alerting rules
are configured very similarly to recording rules which you will get to know later in this training. The main difference is that the rules expression contains a threshold (e.g., query_expression >= 5) and that an alert is sent to the Alertmanager in case the rule evaluation matches the threshold. An alerting rule can be based on a recording rule or be a normal expression query.
Note
Sometimes the community or the maintainer of your Prometheus exporter already provide generic Prometheus alerting rules that can be adapted to your needs. For this reason, it makes sense to do some research before writing alerting rules from scratch. Before implementing such a rule, you should always understand and verify the rule. Here are some examples:
- MySQL: mysqld-mixin
- Strimzi Kafka Operator: strimzi/strimzi-kafka-operator
- General rules for Kubernetes: kubernetes-mixin-ruleset
- General rules for various exporters: samber/awesome-prometheus-alerts
Templates for awesome rules
Whenever creating PrometheusRules you can always expect other people having the same problem as you. On this site you can find a collection of different PrometheusRules for a big amount of cloud native technology.
7.1 Tasks: Setup custom alerting rules
Task 7.1.1: Add alerting rules
Note
Alertmanager will automatically send mails to the definedresponsible email address in the teams root configuration when you set the label severity=critical in your PrometheusRule.
To change this behaviour and/or add Alerting to MS Teams, check the documentation 03 - Setup custom alerting rules
in Confluence.The Prometheus Operator allows you to configure Alerting Rules (PrometheusRules). This enables OpenShift users to configure and maintain alerting rules for their projects. Furthermore it is possible to treat Alerting Rules like any other Kubernetes resource and lets you manage them in Helm or Kustomize. A PrometheusRule has the following form:
apiVersion: monitoring.coreos.com/v1
kind: PrometheusRule
metadata:
  name: <resource-name>
spec:
  <rule definition>
See the Alertmanager documentation
for <rule definition>
Example:
To add an Alerting rule, create a PrometheusRule resource training_testrules.yaml in the monitoring folder of your CAASI Team Config Repository.
apiVersion: monitoring.coreos.com/v1
kind: PrometheusRule
metadata:
  name: testrules
spec:
  groups:
    - name: testrulesgroup
      rules:
        - alert: kubePodCrashLooping # this will be the mail subject, enter which ever text you want
          expr: rate(kube_pod_container_status_restarts_total{job="kube-state-metrics",namespace="<team>-monitoring"}[5m]) * 60 * 5 > 0
          for: 15m
          annotations:
            message: Pod {{ $labels.namespace }}/{{ $labels.pod }} ({{ $labels.container }}) is restarting {{ printf "%.2f" $value }} times / 5 minutes.
          labels:
            severity: info
This will fire an alert, everytime the following query matches
rate(kube_pod_container_status_restarts_total{job="kube-state-metrics",namespace="<team>-monitoring"}[5m]) * 60 * 5 > 0
You can build/verify your Query in your Thanos Querier UI . As soon, as you apply the PrometheusRule resource, you should be able to see the alert in your Thanos Ruler implementation.
Task 7.1.2: Send a test alert
In this task you can use the amtool command to send a test alert.
To send a test alert with the labels alertname=Up and node=bar you can simply execute the following command.
Note
As you will be executing some oc commands in the following labs, make sure you are logged in to your OpenShift Cluster.
You can copy the login Command from the OpenShift UI:
- Browse to http://LOCALHOST_OPENSHIFT
- Click on your name in the top right
Copy login command- Replace
6443with443
team=<team>
oc -n $team-monitoring exec -it sts/alertmanager-alertmanager -- sh
amtool alert add --alertmanager.url=http://localhost:9093 alertname=Up node=bar
Check in the Alertmanger web UI if you see the test alert with the correct labels set.
Task 7.1.3: Show the routing tree
Show routing tree:
team=<team>
oc -n $team-monitoring exec -it sts/alertmanager-alertmanager -- sh
amtool config routes --config.file /etc/alertmanager/config/alertmanager.yaml
Depending on the configured receivers your output might vary.
The routing tree of the monitoring stack in namespace infra-config is more complex than the one of the examples-monitoring namespace:
Namespace config-caasi01-monitoring:
$ oc -n config-caasi01-monitoring exec -it sts/alertmanager-alertmanager -- amtool config routes --config.file /etc/alertmanager/config/alertmanager.yaml
Routing tree:
.
└── default-route  receiver: default
    ├── {severity=~"^(?:critical|warning)$"}  continue: true  receiver: mail-critical
    ├── {alertname=~"^(?:DeadMansSwitch)$"}  receiver: deadmanswitch
    ├── {env="prod",severity="critical"}  receiver: teams-critical-prod
    ├── {env="prod",severity="warning"}  receiver: teams-warning-prod
    ├── {env="prod"}  receiver: teams-info-prod
    ├── {env!="prod",severity="critical"}  receiver: teams-critical-nonprod
    ├── {env!="prod",severity="warning"}  receiver: teams-warning-nonprod
    ├── {env!="prod",severity="info"}  receiver: teams-info-nonprod
    └── {env!="prod"}  receiver: teams-warning-prod
Namespace examples-monitoring:
$ oc -n examples-monitoring exec -it sts/alertmanager-alertmanager -- amtool config routes --config.file /etc/alertmanager/config/alertmanager.yaml
Routing tree:
.
└── default-route  receiver: default
Task 7.1.4: Silencing alerts
Sometimes the huge amount of alerts can be overwhelming, or you’re currently working on fixing an issue, which triggers an alert. Or you’re simply testing something that fires alerts.
In such cases alert silencing can be very helpful.
Let’s now silence our test alert.
Open the Alertmanger web UI and search for the test alert.
Note
The alert might have been resolved already, use the following command to re-trigger it again:
team=<team>
oc -n $team-monitoring exec -it sts/alertmanager-alertmanager -- sh
amtool alert add --alertmanager.url=http://localhost:9093 alertname=Up node=bar
You can either silence the specific alert by simply clicking on the Silcence button next to the alert, or create a new silence by clicking the New Silence button in the top menu on the right.
Either way, you’ll end up on the same form. The button next to the alert will conveniently fill out the matchers, so that the alert will be affected by the new silence.
- Click the
Silencebutton next to the test alert. - Make sure the matchers contains the two labels (
alertname="Up",node="bar") of the test alert. - Set the duration to 1h
- Add your username to the creator form field.
- Fill out the description with the reason you’re creating a silence.
You can then use the Preview Alerts button to check your matchers and create the alert by clicking create.
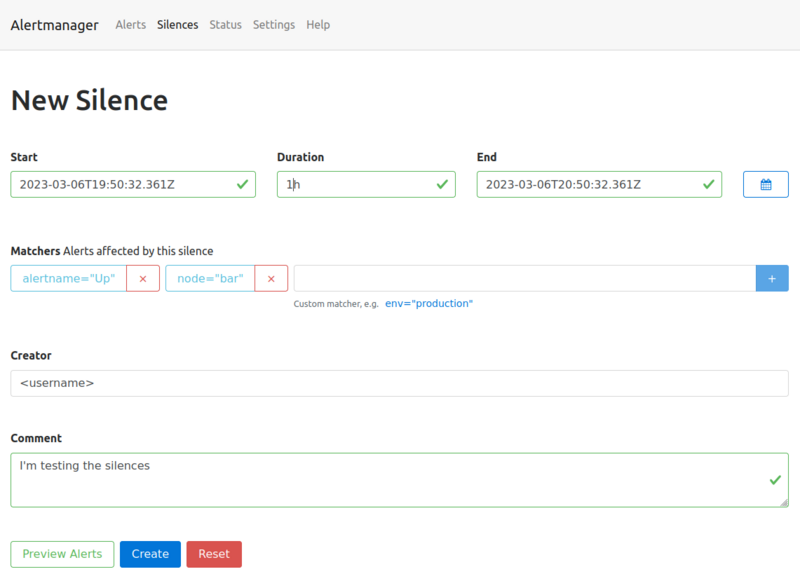
All alerts, which match the defined labels of the matcher will be silenced for the defined time slot.
Go back to the Alerts page, the silenced alert disappeared and will only be visible when checking the silenced alerts checkbox.
The top menu entry silence will show you a list of the created silences. Silences can also be created programmatically using the API or the amtool (amtool silence --help).
The following command is exactly the same you just did via the Web UI:
team=<team>
oc -n $team-monitoring exec -it sts/alertmanager-alertmanager -- sh
amtool silence add alertname=Up node=bar --author="<username>" --comment="I'm testing the silences" --alertmanager.url=http://localhost:9093
Task 7.1.5: Test your alert receivers
Add a test alert and check if your defined target mailbox receives the mail. It can take up to 5 minutes as the alarms are grouped together based on the group_interval .
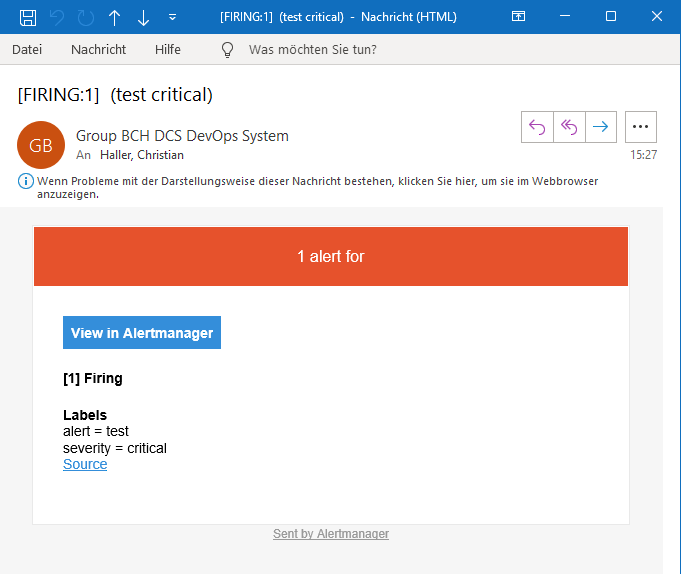
team=<team>
oc -n $team-monitoring exec -it sts/alertmanager-alertmanager -- sh
amtool alert add --alertmanager.url=http://localhost:9093 env=dev severity=critical
Note
Alerts with the labelseverity=critical will send a mail to the defined responsible mail address in the teams root configuration
and post the alert as a message in the defined Teams channel (if enabled).Example:
oc -n examples-monitoring exec -it sts/alertmanager-alertmanager -- sh
amtool alert add --alertmanager.url=http://localhost:9093 alert=test severity=critical
It is also advisable to validate the routing configuration against a test dataset to avoid unintended changes. With the option --verify.receivers the expected output can be specified:
team=<team>
oc -n $team-monitoring  exec -it sts/alertmanager-alertmanager -- sh
amtool config routes test --config.file /etc/alertmanager/config/alertmanager.yaml --verify.receivers=mail-critical env=dev severity=info
default
WARNING: Expected receivers did not match resolved receivers.
team=<team>
oc -n $team-monitoring exec -it sts/alertmanager-alertmanager -- sh
amtool config routes test --config.file /etc/alertmanager/config/alertmanager.yaml --verify.receivers=mail-critical env=prod severity=critical
8. Advanced Topics
This section covers different advanced topis.
8.1 Tasks: Relabeling
Relabeling in Prometheus can be used to perform numerous tasks using regular expressions, such as
- adding, modifying or removing labels to/from metrics or alerts,
- filtering metrics based on labels, or
- enabling horizontal scaling of Prometheus by using
hashmodrelabeling.
It is a very powerful part of the Prometheus configuration, but it can also get quite complex and confusing. Thus, we will only take a look at some basic/simple examples.
There are four types of relabelings:
relabel_configs(target relabeling)Target relabeling is defined in the job definition of a
scrape_config. When using the Prometheus Operator, customrelabel_configscan be added to theServiceMonitor. This concept is also used to configure scraping of a multi-target exporter (e.g.,blackbox_exporterorsnmp_exporter) where one single exporter instance is used to scrape multiple targets. Check out the Prometheus docs for a detailed explanation and example configurations ofrelabel_configs.metric_relabel_configs(metrics relabeling)Metrics relabeling is applied to scraped samples right before ingestion. It allows adding, modifying, or dropping labels or even dropping entire samples if they match certain criteria.
alert_relabel_configs(alert relabeling)Alert relabeling is similar to
metric_relabel_configs, but applies to outgoing alerts.write_relabel_configs(remote write relabeling)Remote write relabeling is similar to
metric_relabel_configs, but applies toremote_writeconfigurations.
8.2 Tasks: Recording Rules
Prometheus recording rules
allow you to precompute queries at a defined interval (global.evaluation_interval or interval in rule_group) and save them to a new set of time series.
In this lab you are going to create your first own recording rules. Recording rules
are very useful when it comes to queries, which are very complex and take a long time to compute.
The naming convention dictates to use the following format when naming recording rules level:metric:operation. Additional information regarding naming best-practices can be found here
.
Warning
Recording rules store the result in a new series and they can add additional complexity.Task 8.2.1: Memory usage recording rule
With the following recording rule, we create a new metric that represents the available memory on a node as a percentage. A metric the node exporter doesn’t expose when running on a machine with an older Linux kernel and needs to be calculated every time.
- Query the recording rule in the Prometheus web UI
Hints
- Add the following recording rule file
training_prometheusrule_avail_memory.yamlto your monitoring directory, commit and push your changes.
apiVersion: monitoring.coreos.com/v1
kind: PrometheusRule
metadata:
  name: prometheusrule-avail-memory
spec:
  groups:
    - name: node_memory
      rules:
        - record: :node_memory_MemAvailable_bytes:sum
          expr: |
            (1 - (
              sum by(instance) (node_memory_MemFree_bytes{instance="prometheus-training.balgroupit.com:9100"}
              +
              node_memory_Cached_bytes{instance="prometheus-training.balgroupit.com:9100"}
              +
              node_memory_Buffers_bytes{instance="prometheus-training.balgroupit.com:9100"}
            )
            )
            /
              sum by(instance) (node_memory_MemTotal_bytes{instance="prometheus-training.balgroupit.com:9100"}))
            * 100
After configuring the recording rule and reloading the configuration, Prometheus provides those metrics accordingly.
Note
It may take up to one minute for the recording rule to become available.
Use your recording_rule definition in the expression browser:
:node_memory_MemAvailable_bytes:sum
or hit the following link
Note
If you take a look at the historical metrics, you will notice that there is no backfilling (by default) of your data. Only data since activation of the recording rule is available. Optional backfilling can be accomplished by using thepromtool utilityNote
Perhaps you have noticed that the rule name starts with a colon. While this may seem odd at first sight, this is actually the result of following the naming convention mentioned above. The rule does not aggregate over a certainlevel and therefore the first field of level:metric:operation remains empty.Task 8.2.2: CPU utilization recording rule
In this lab you are going to create a CPU utilization recording rule.
- Create a rule to record the CPU utilization of your server
- Make sure that Prometheus evaluates this rule every 60 seconds
- Verify in the web UI that you can query your recording rule
Hints
As you saw in a previous exercise, the node_cpu_seconds_total metric contains the CPU utilization of a node. We can use the mode label on this metric to filter for idle cpu time.
All other modes than idle indicate, that the CPU is used. Therefore we can simply subtract the idle percentage from 100 % and get the value we want.
- Add the following recording rule file
training_recording_rule_cpu_usage.yamlto your monitoring directory, commit and push your changes.
apiVersion: monitoring.coreos.com/v1
kind: PrometheusRule
metadata:
  name: recording-rule-cpu-usage
spec:
  groups:
    - name: node_cpu
      interval: 60s
      rules:
        - record: instance:node_cpu_utilisation:rate5m
          expr: |
            100 - (
              avg by (instance) (rate(node_cpu_seconds_total{mode="idle",instance="prometheus-training.balgroupit.com:9100"}[5m]))
              * 100
            )
Query your recording rule using the expression browser
8.3 Tasks: Troubleshoot Kubernetes Service Discovery
Task 8.3.1: Troubleshooting Kubernetes Service Discovery
We will now deploy an application with an error in the monitoring configration.
Deploy Loki in the monitoring namespace.
Create a deployment training_loki-deployment.yaml.
apiVersion: apps/v1
kind: Deployment
metadata:
  labels:
    app: loki
  name: example-loki
spec:
  replicas: 1
  selector:
    matchLabels:
      app: loki
  template:
    metadata:
      labels:
        app: loki
    spec:
      containers:
      - image: quay.balgroupit.com/acend/loki
        imagePullPolicy: Always
        name: loki
        volumeMounts:
        - mountPath: /loki/chunks
          name: chunks
        - mountPath: /loki/boltdb-shipper-cache
          name: boltdb-shipper-cache
        - mountPath: /loki/boltdb-shipper-active
          name: shipper-active
        - mountPath: /loki/wal
          name: wal
        - mountPath: /loki/compactor
          name: compactor
      restartPolicy: Always
      volumes:
      - name: chunks
        emptyDir: {}
      - name: boltdb-shipper-cache
        emptyDir: {}
      - name: shipper-active
        emptyDir: {}
      - name: wal
        emptyDir: {}
      - name: compactor
        emptyDir: {}
Create a Service training_service-loki.yaml.
apiVersion: v1
kind: Service
metadata:
  name: loki
  labels:
    app: loki
spec:
  ports:
    - name: http
      port: 3100
      protocol: TCP
      targetPort: 3100
  selector:
    app: loki
  type: ClusterIP
Create the Loki ServiceMonitor training_servicemonitor-loki.yaml.
apiVersion: monitoring.coreos.com/v1
kind: ServiceMonitor
metadata:
  labels:
    app.kubernetes.io/name: loki
  name: loki
spec:
  endpoints:
    - interval: 30s
      port: http
      scheme: http
      path: /metrics
  selector:
    matchLabels:
      prometheus-monitoring: 'true'
- When you visit the Prometheus user interface you will notice that the Prometheus Server does not scrape metrics from Loki. Try to find out why.
Troubleshooting: Prometheus is not scraping metrics
The cause that Prometheus is not able to scrape metrics is usually one of the following:
- The configuration defined in the ServiceMonitor does not appear in the Prometheus scrape configuration.
- Check if the label of your ServiceMonitor matches the label defined in the
serviceMonitorSelectorfield of the Prometheus custom resource - Check the Prometheus operator logs for errors (permission issues or invalid ServiceMonitors)
- Check if the label of your ServiceMonitor matches the label defined in the
- The Endpoint appears in the Prometheus scrape config but not under targets.
- The namespaceSelector in the ServiceMonitor does not match the namespace of your app
- The label selector does not match the Service of your app
- The port name does not match the Service of your app
- The Endpoint appears as a Prometheus target, but no data gets scraped.
- The application does not provide metrics under the correct path and port
- Networking issues
- Authentication required, but not configured
Hints
The quickest way to do this is to follow the instructions in the info box above. So let’s first find out which of the following statements apply to us:
- The configuration defined in the ServiceMonitor does not appear in the Prometheus scrape configuration.
- Let’s check if Prometheus reads the configuration defined in the ServiceMonitor resource. To do so, navigate to Prometheus configuration
and search if
lokiappears in the scrape_configuration. You should find a job with the nameserviceMonitor/loki/loki/0, therefore this should not be the issue in this case.
- Let’s check if Prometheus reads the configuration defined in the ServiceMonitor resource. To do so, navigate to Prometheus configuration
and search if
- The Endpoint appears in the Prometheus configuration
but not under targets.
Let’s check if the application is running:
oc -n <team>-monitoring get pod -l app=lokiThe output should be similar to the following:
NAME                    READY   STATUS    RESTARTS   AGE
example-loki-7bb486b647-dj5r4          1/1     Running   0             112s
Lets check if the application is exposing metrics:
PODNAME=$(oc -n <team>-monitoring get pod -l app=loki -o name)
oc -n <team>-monitoring exec $PODNAME -it -- wget -O - localhost:3100/metrics
...
The application exposes metrics and Prometheus generated the configuration according to the defined ServiceMonitor. Let’s verify, if the ServiceMonitor matches the Service.
oc -n <team>-monitoring get svc loki -o yamlapiVersion: v1 kind: Service metadata: ... labels: app: loki argocd.argoproj.io/instance: ... name: loki spec: ... ports: - name: http ...We see that the Service has the port named
httpand the labelapp: lokiset. Let’s check the ServiceMonitor:oc -n <team>-monitoring get servicemonitor loki -o yamlapiVersion: monitoring.coreos.com/v1 kind: ServiceMonitor ... spec: endpoints: - interval: 30s ... port: http ... selector: matchLabels: prometheus-monitoring: "true"We see that the ServiceMonitor expect the port named
httpand a labelprometheus-monitoring: "true"set. So the culprit is the missing label. Let’s set the label on the Service by updating the the servicetraining_service-loki.yaml.apiVersion: v1 kind: Service metadata: name: loki labels: app: loki prometheus-monitoring: "true" spec: ...Verify that the target gets scraped in the Prometheus user interface .
8.4 Tasks: Cleanup your monitoring workspace
Task 8.4.1: Cleanup your monitoring workspace
Make sure to remove all files with the training_ prefix in your monitoring directory.