7.1 Tasks: Setup custom alerting rules
Task 7.1.1: Add alerting rules
Note
Alertmanager will automatically send mails to the definedresponsible email address in the teams root configuration when you set the label severity=critical in your PrometheusRule.
To change this behaviour and/or add Alerting to MS Teams, check the documentation 03 - Setup custom alerting rules
in Confluence.The Prometheus Operator allows you to configure Alerting Rules (PrometheusRules). This enables OpenShift users to configure and maintain alerting rules for their projects. Furthermore it is possible to treat Alerting Rules like any other Kubernetes resource and lets you manage them in Helm or Kustomize. A PrometheusRule has the following form:
apiVersion: monitoring.coreos.com/v1
kind: PrometheusRule
metadata:
  name: <resource-name>
spec:
  <rule definition>
See the Alertmanager documentation
for <rule definition>
Example:
To add an Alerting rule, create a PrometheusRule resource training_testrules.yaml in the monitoring folder of your CAASI Team Config Repository.
apiVersion: monitoring.coreos.com/v1
kind: PrometheusRule
metadata:
  name: testrules
spec:
  groups:
    - name: testrulesgroup
      rules:
        - alert: kubePodCrashLooping # this will be the mail subject, enter which ever text you want
          expr: rate(kube_pod_container_status_restarts_total{job="kube-state-metrics",namespace="<team>-monitoring"}[5m]) * 60 * 5 > 0
          for: 15m
          annotations:
            message: Pod {{ $labels.namespace }}/{{ $labels.pod }} ({{ $labels.container }}) is restarting {{ printf "%.2f" $value }} times / 5 minutes.
          labels:
            severity: info
This will fire an alert, everytime the following query matches
rate(kube_pod_container_status_restarts_total{job="kube-state-metrics",namespace="<team>-monitoring"}[5m]) * 60 * 5 > 0
You can build/verify your Query in your Thanos Querier UI . As soon, as you apply the PrometheusRule resource, you should be able to see the alert in your Thanos Ruler implementation.
Task 7.1.2: Send a test alert
In this task you can use the amtool command to send a test alert.
To send a test alert with the labels alertname=Up and node=bar you can simply execute the following command.
Note
As you will be executing some oc commands in the following labs, make sure you are logged in to your OpenShift Cluster.
You can copy the login Command from the OpenShift UI:
- Browse to http://LOCALHOST_OPENSHIFT
- Click on your name in the top right
Copy login command- Replace
6443with443
team=<team>
oc -n $team-monitoring exec -it sts/alertmanager-alertmanager -- sh
amtool alert add --alertmanager.url=http://localhost:9093 alertname=Up node=bar
Check in the Alertmanger web UI if you see the test alert with the correct labels set.
Task 7.1.3: Show the routing tree
Show routing tree:
team=<team>
oc -n $team-monitoring exec -it sts/alertmanager-alertmanager -- sh
amtool config routes --config.file /etc/alertmanager/config/alertmanager.yaml
Depending on the configured receivers your output might vary.
The routing tree of the monitoring stack in namespace infra-config is more complex than the one of the examples-monitoring namespace:
Namespace config-caasi01-monitoring:
$ oc -n config-caasi01-monitoring exec -it sts/alertmanager-alertmanager -- amtool config routes --config.file /etc/alertmanager/config/alertmanager.yaml
Routing tree:
.
└── default-route  receiver: default
    ├── {severity=~"^(?:critical|warning)$"}  continue: true  receiver: mail-critical
    ├── {alertname=~"^(?:DeadMansSwitch)$"}  receiver: deadmanswitch
    ├── {env="prod",severity="critical"}  receiver: teams-critical-prod
    ├── {env="prod",severity="warning"}  receiver: teams-warning-prod
    ├── {env="prod"}  receiver: teams-info-prod
    ├── {env!="prod",severity="critical"}  receiver: teams-critical-nonprod
    ├── {env!="prod",severity="warning"}  receiver: teams-warning-nonprod
    ├── {env!="prod",severity="info"}  receiver: teams-info-nonprod
    └── {env!="prod"}  receiver: teams-warning-prod
Namespace examples-monitoring:
$ oc -n examples-monitoring exec -it sts/alertmanager-alertmanager -- amtool config routes --config.file /etc/alertmanager/config/alertmanager.yaml
Routing tree:
.
└── default-route  receiver: default
Task 7.1.4: Silencing alerts
Sometimes the huge amount of alerts can be overwhelming, or you’re currently working on fixing an issue, which triggers an alert. Or you’re simply testing something that fires alerts.
In such cases alert silencing can be very helpful.
Let’s now silence our test alert.
Open the Alertmanger web UI and search for the test alert.
Note
The alert might have been resolved already, use the following command to re-trigger it again:
team=<team>
oc -n $team-monitoring exec -it sts/alertmanager-alertmanager -- sh
amtool alert add --alertmanager.url=http://localhost:9093 alertname=Up node=bar
You can either silence the specific alert by simply clicking on the Silcence button next to the alert, or create a new silence by clicking the New Silence button in the top menu on the right.
Either way, you’ll end up on the same form. The button next to the alert will conveniently fill out the matchers, so that the alert will be affected by the new silence.
- Click the
Silencebutton next to the test alert. - Make sure the matchers contains the two labels (
alertname="Up",node="bar") of the test alert. - Set the duration to 1h
- Add your username to the creator form field.
- Fill out the description with the reason you’re creating a silence.
You can then use the Preview Alerts button to check your matchers and create the alert by clicking create.
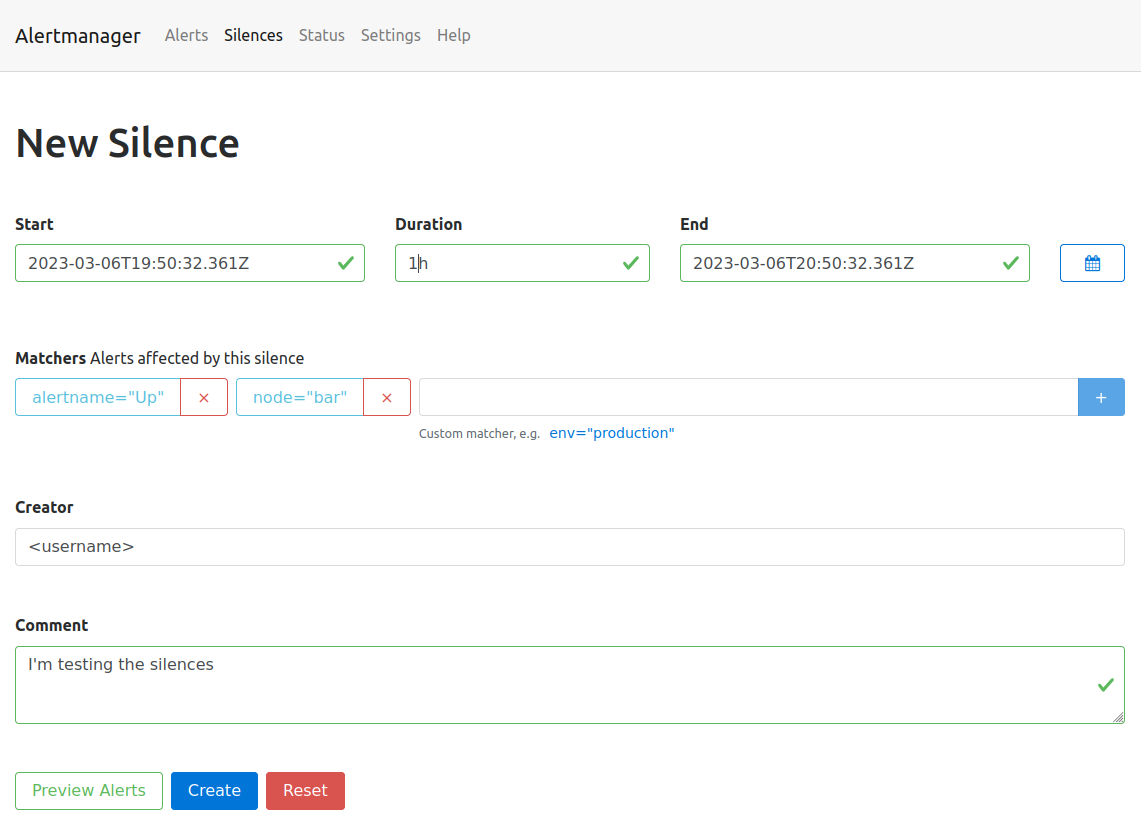
All alerts, which match the defined labels of the matcher will be silenced for the defined time slot.
Go back to the Alerts page, the silenced alert disappeared and will only be visible when checking the silenced alerts checkbox.
The top menu entry silence will show you a list of the created silences. Silences can also be created programmatically using the API or the amtool (amtool silence --help).
The following command is exactly the same you just did via the Web UI:
team=<team>
oc -n $team-monitoring exec -it sts/alertmanager-alertmanager -- sh
amtool silence add alertname=Up node=bar --author="<username>" --comment="I'm testing the silences" --alertmanager.url=http://localhost:9093
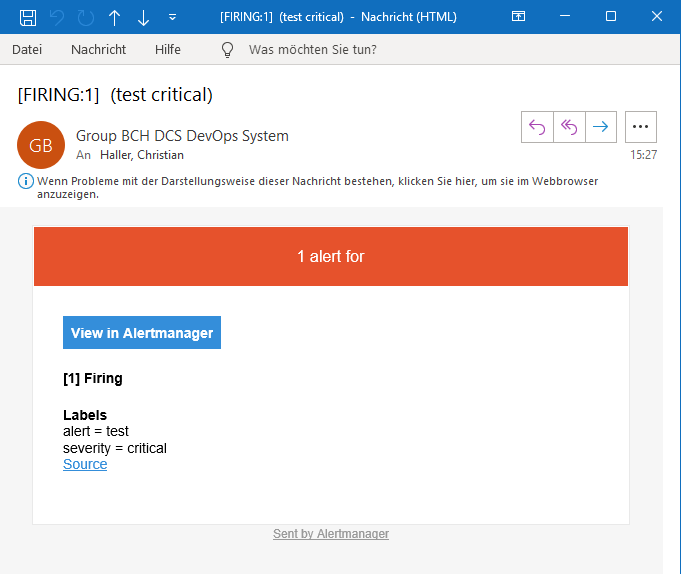
Task 7.1.5: Test your alert receivers
Add a test alert and check if your defined target mailbox receives the mail. It can take up to 5 minutes as the alarms are grouped together based on the group_interval .
team=<team>
oc -n $team-monitoring exec -it sts/alertmanager-alertmanager -- sh
amtool alert add --alertmanager.url=http://localhost:9093 env=dev severity=critical
Note
Alerts with the labelseverity=critical will send a mail to the defined responsible mail address in the teams root configuration
and post the alert as a message in the defined Teams channel (if enabled).Example:
oc -n examples-monitoring exec -it sts/alertmanager-alertmanager -- sh
amtool alert add --alertmanager.url=http://localhost:9093 alert=test severity=critical
It is also advisable to validate the routing configuration against a test dataset to avoid unintended changes. With the option --verify.receivers the expected output can be specified:
team=<team>
oc -n $team-monitoring  exec -it sts/alertmanager-alertmanager -- sh
amtool config routes test --config.file /etc/alertmanager/config/alertmanager.yaml --verify.receivers=mail-critical env=dev severity=info
default
WARNING: Expected receivers did not match resolved receivers.
team=<team>
oc -n $team-monitoring exec -it sts/alertmanager-alertmanager -- sh
amtool config routes test --config.file /etc/alertmanager/config/alertmanager.yaml --verify.receivers=mail-critical env=prod severity=critical