3.2 Tasks: Grafana dashboards
Task 3.2.1: Import a dashboard
As a first Task we import an existing dashboard to our grafana. There is a huge collection of predefined dashboards available on https://grafana.com/grafana/dashboards .
In this task we learn how to import existing dashboards, which we can also use as reference to write our own queries and dashboards.
Choose one or more of the preexisting dashboards from https://grafana.com/grafana/dashboards
and import them into your grafana. Use the daterange, interval picker on the top right to change the timerange (between 5 minutes and 10 minutes) of the displayed mertics.
Note
You can import for example the Node Exporter Full dashboard, which will present you useful metrics about your linux servers
Hints
- Navigate to https://grafana.com/grafana/dashboards/1860-node-exporter-full/ and download the JSON
- On your Grafana web UI
- Navigate to Dashboards (Icon with the four squares on the left navigation menu) > New > Import
- Paste the contents of the downloaded JSON into the Import via panel json field
- Hit Load
- Choose your thanos-querier data source and hit Import
- Open the dashboard time control (to the upper right)
- Set From to
now-10m - Set To to
now-5m - Hit Apply time range
- Set From to
Task 3.2.2: Create your first dashboard
In this task you’re going to create your first own dashboard happy_little_dashboard. You will add the panel CPU Utilisation based on the following query:
100 - (
  avg by (instance) (rate(node_cpu_seconds_total{mode="idle",instance="prometheus-training.balgroupit.com:9100"}[5m]))
  * 100
)
Hints
- Navigate to Dashboards (Icon with the four squares on the left navigation menu)> New > New Dashboard
- Select Add visualization
- Select the thanos-querier data source
- In general, metrics can be built using the Grafana Query Builder or using “plain” PromQL queries. You can easily switch between these two at the top right of the query window. Going forward, we will use plain PromQL queries.
- Add the expression from above into the text field right next to the Metrics Browser dropdown
- Set the panel title to
CPU Utilisationunder Panel options > Title (you may need to open the options pane with the < button on the right hand side just below the Apply button) - Save the dashboard and give it the name
happy_little_dashboard
Task 3.2.3: Add a Gauge panel to the dashboard
Task description:
Add another panel to the existing happy_little_dashboard with the panel name Memory Available. Display the following query:
(1 - (
  sum by(instance) (node_memory_MemFree_bytes{instance="prometheus-training.balgroupit.com:9100"}
  +
  node_memory_Cached_bytes{instance="prometheus-training.balgroupit.com:9100"}
  +
  node_memory_Buffers_bytes{instance="prometheus-training.balgroupit.com:9100"}
)
)
/
  sum by(instance) (node_memory_MemTotal_bytes{instance="prometheus-training.balgroupit.com:9100"}))
* 100
Also, change the panel type to Gauge and display it in %. Define the following thresholds:
0% (red)
20% (orange)
50% (green)
Hints
- Hit Add (top navigation menu) > Visualization
- Select the thanos-querier data source
- Add the expression from above into the text field right next to the Metrics Browser dropdown
- Set the panel title to
Memory Availableunder Panel options > Title (you may need to open the options pane with the < button on the right hand side just below the Apply button)
- Define unit under Standard options > Unit > Misc / Percent (0-100)
- Choose Gauge in the dropdown menu just below the Apply button
- Add
20and50thresholds under Thresholds- Choose Red for Base
- Choose Orange for 20
- Choose Green for 50
- Save the dashboard
Task 3.2.4: Add a Stat panel that uses a variable to the dashboard
Add another panel to the existing happy_little_dashboard with the panel name Disk Available that uses a variable. Name the variable disk and label it Select disk. To calculate the available disk space of a certain mountpoint in percent, use the following query:
100 - ((node_filesystem_avail_bytes{mountpoint="$disk", instance="prometheus-training.balgroupit.com:9100"} * 100) / node_filesystem_size_bytes{mountpoint="$disk", instance="prometheus-training.balgroupit.com:9100"})
Also, change the panel type to Stat and display the value in %. Define the following thresholds:
0% (red)
10% (orange)
25% (green)
Hints
- First, we create the variable. Hit the little gear icon on the top right corner of the dashboard
- Select Variables in the menu on the left > Add Variable
- As we want the available values for the variable to be calculated dynamically, we will use a PromQL query for this as well. Thus, choose Query in the dropdown menu for
variable type - Set
Nametodisk - Set
LabeltoSelect disk - Select the thanos-querier data source
- Set
Query TypetoLabel values - Choose the label
mountpoint - As we are only interested in the mountpoint label of our linux VM, enter the metric
node_filesystem_avail_bytes{instance="prometheus-training.balgroupit.com:9100"} - The preview at the bottom should now already show the different mountpoints of the server
- Leave everything else as is, apply and navigate back to the dashboard
- Now, let’s use the variable in a new panel. Hit Add (top navigation menu) > Visualization
- Select the thanos-querier data source
- Add the query
100 - ((node_filesystem_avail_bytes{mountpoint="$disk", instance="prometheus-training.balgroupit.com:9100"} * 100) / node_filesystem_size_bytes{mountpoint="$disk", instance="prometheus-training.balgroupit.com:9100"})to the Metrics browser field - Set the panel title to
Disk Availableunder Panel options > Title (you may need to open the options pane with the < button on the right hand side just below the Apply button) - Define unit under Standard options > Unit > Misc / Percent (0-100)
- Choose Stat in the dropdown menu just below the Apply button
- Add
10and25thresholds under Thresholds- Choose Red for Base
- Choose Orange for 10
- Choose Green for 25
- Save the dashboard
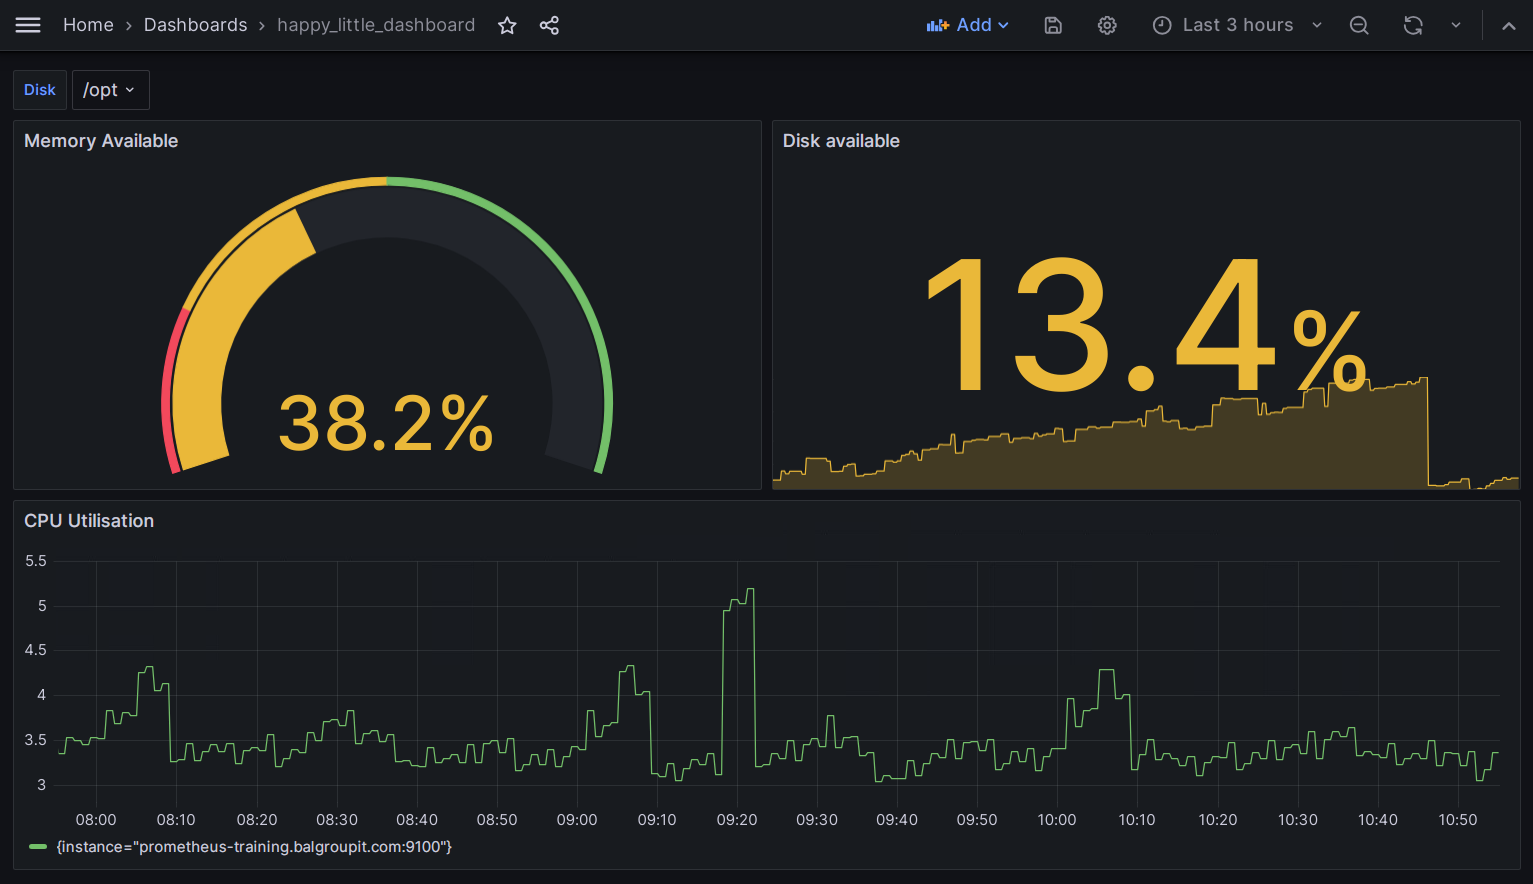
If everything went well, depending on the formatting you chose, the dashboard should look something like this:
Task 3.2.4: Save your dashboard to GIT
The dashboards will only be persisted in your GIT repo. Manually clicked dashboards get deleted everytime Grafana restarts. Therefore, let us make sure that your dashboard will not be lost.
- Save your dashboard to your monitoring directory
- Follow the following documentation
Hints
- On your Grafana web UI
- Navigate to your Dashboard
happy_little_dashboard - Select Dashboard settings (Icon on the top navigation menu that looks like a gear)
- Select <> JSON Model
- Copy the JSON content and save the file
training_dashboard.yamlin the monitoring folder:
- Navigate to your Dashboard
apiVersion: v1
kind: ConfigMap
metadata:
  labels:
    dashboard: <team>-infra
  name: training-dashboard
data:
  training-dashboard.json: |-
    {
      Your dashboard JSON definition
    }
Note
Pay attention to YAML syntax, especially indentation.
  training-dashboard.json: |-
    {
      "annotations": {
        "list": [
          {
...
To ensure that the dashboard provisioning works as specified, try deleting the dashboard using the Grafana user interface.
- On your Grafana web UI
- Navigate to your Dashboard
happy_little_dashboard - Select Dashboard settings (Icon on the top navigation menu that looks like a gear)
- Click on Delete Dashboard
- Navigate to your Dashboard
You should see a warning message that prevents deleting provisioned dashboards.