2.2 Tasks: Explore metrics
In this lab you are going to explore various metrics, which your Prometheus server is collecting.
Task 2.2.1: Prometheus/Thanos web UI
As we have multiple Prometheus instances, we will use the Thanos Querier to query metrics on our Prometheus instances running on different clusters. To get an overview of the how Thanos fits into the picture, check out the diagram in Confluence
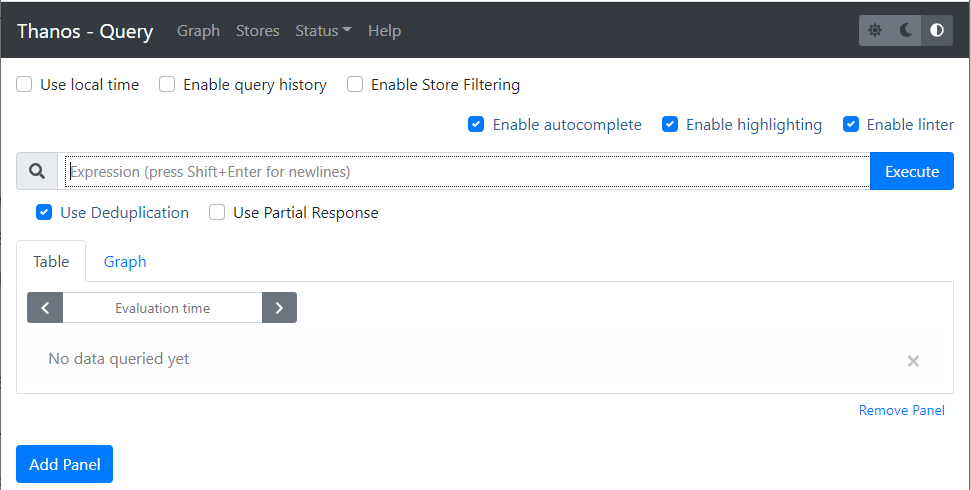
Get a feel for how to use the Thanos Querier web UI. Open the web UI and navigate to the Graph menu (right on top in the grey navigation bar next to Stores).
Hints
Let’s start and find a memory related metric. The best way to start is by typing node_memory in the expression bar.
Note
As soon as you start typing a dropdown with matching metrics is shown.
Select a metric such as node_memory_MemFree_bytes and click the Execute button.
The result of your first Query will be available under the two tabs:
- Table
- Graph
Explore those two views on your results. Shrink the time range in the Graph tab.
Task 2.2.2: Metric Prometheus server version
Prometheus collects its own metrics, so information such as the current build version of your Prometheus server is displayed as a metric.
Let’s find a metric that shows you the version of your Prometheus server.
Hints
Start typing prometheus_... in the expression browser, choose the prometheus_build_info metric and click the Execute Button.
Something similar to the following will be displayed
prometheus_build_info{branch="HEAD", cluster="caasi01", container="prometheus-proxy", endpoint="web", goversion="go1.18.4", instance="172.16.2.103:9093", job="prometheus", monitoringselector="clustermonitoring", namespace="ch-application-security-monitoring", pod="prometheus-prometheus-0", prometheus="config-caasi01-monitoring/prometheus", revision="b41e0750abf5cc18d8233161560731de05199330", service="prometheus", version="2.37.0"}
...
The actual Version of your Prometheus Server will be available as label version
{version="2.37.0"}
Task 2.2.3: Metric TCP sockets
Let’s explore a node exporter metric in this lab.
- Find a metric that shows you the number of TCP sockets in use
- Display the number 5 minutes ago
- Display the numbers in a graph over the last 15 minutes
Hints
The node exporter metrics are all available in the node namespace
.
The number of TCP sockets in use are available in the following metric.
node_sockstat_TCP_inuse
You can select a specific time series by filtering by the instance label.
node_sockstat_TCP_inuse{instance="prometheus-training.balgroupit.com:9100"}
If you want to display the value 5 minutes ago, you’ll have to add the correct timestamp in the Evaluation time field.
Switch to the Graph tab and change the value of the timepicker from 1h to 15m to display the graph over the last 15 minutes.
Task 2.2.4: Metric network interfaces
Most virtual Linux machines nowadays have network interfaces. The node exporter you have enabled and configured in the previous lab also exposes metrics about network components.
Show all network interfaces where the device name starts with ens
Hints
The network interfaces are available in the following series:
node_network_info
The result includes all sorts of network interface. If you need to filter the result by a label you will have to alter your query:
node_network_info{device="ens192"}
But this will only show results for the exact ens192 interface. The Task was to show all interfaces that start with ens192.
In this case we have to use Time series Selectors to create a matching filter:
node_disk_filesystem_info{device=~"sd.*"}
There will be a lot more about queries and filtering in the next Labs
Task 2.2.5: CMDB monitoring (optional)
If your team does not use virtual machines, you can skip this task.
As soon as a virtual machine is defined in the CMDB , it is added to the monitoring stack using the defined business services. These servers are monitored automatically with generally defined alerts. To check if there are already some machines being monitored by the monitoring stack, navigate to your teams Thanos. Your example monitoring stack will obviously not have these targets configured.
- Use the selector
managed="cmdb-service-asset"and the metricup.
Hints
The servers can be listed using the following series:
up{managed="cmdb-service-asset"}
Note
You may not be using virtual machines and therefore the list is empty.